What's a "good" growth rate for a SaaS company? The honest answer is: it depends entirely on your stage. For a startup still under $1 million in Annual Recurring Revenue (ARR), hitting a median growth rate of 50% or more year-over-year is a fantastic sign. The top performers? They often blow past 100%.
As you grow, that explosive pace naturally cools down. But context is everything. This guide makes SaaS growth rate benchmarks clear and actionable, using simple visuals and real-world examples to show you where you stand.
Your SaaS Growth Rate Cheat Sheet
Knowing how your numbers stack up against similar companies is key to setting smart goals and making the right strategic moves. What's considered "good" growth when you're just starting is completely different from what's expected when you're pulling in tens of millions. This cheat sheet gives you a quick, no-nonsense look at the essential saas growth rate benchmarks.
I'll break these benchmarks down by both ARR stage and your funding situation—whether you're bootstrapped or have venture capital in your corner. That distinction really matters, as funding changes everything from growth expectations to how much you can spend to get there.
SaaS Growth Benchmarks by Company Stage
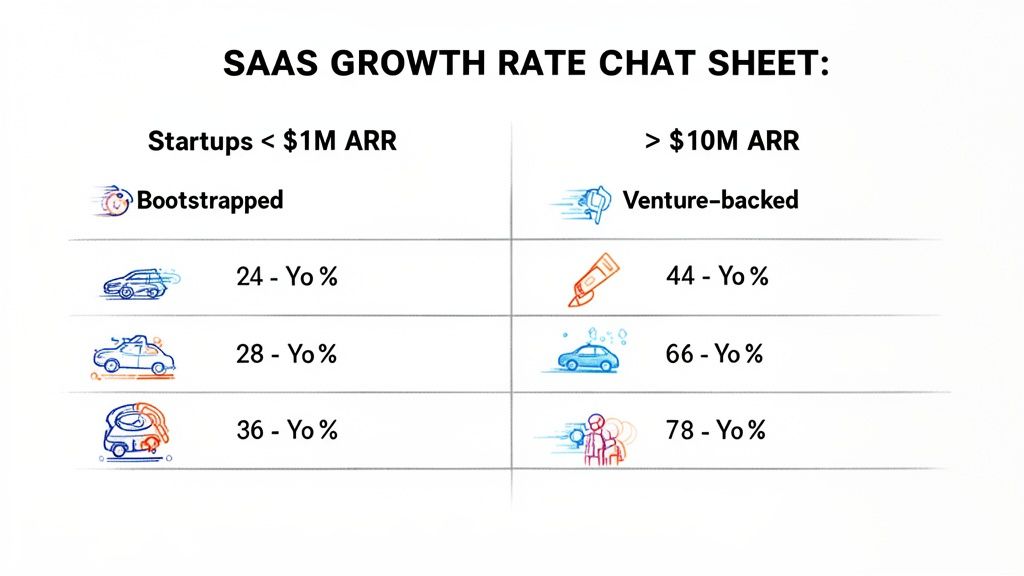
This simple visual breaks down the median Year-over-Year (YoY) growth rates for SaaS companies, segmented by their ARR and whether they're equity-backed or bootstrapped. Use it to quickly see where you stand relative to your peers.
| ARR Range | Median YoY Growth (Equity-Backed) | Median YoY Growth (Bootstrapped) | Top Quartile Performance |
|---|---|---|---|
| Under $1M | 55% | 40% | 100%+ |
| $1M - $5M | 45% | 30% | 70%+ |
| $5M - $10M | 35% | 25% | 50%+ |
| $10M - $20M | 30% | 20% | 40%+ |
| Over $20M | 25% | 15% | 35%+ |
Remember, these are median figures. The top quartile represents the top 25% of companies in that bracket—the ones who are truly outperforming the market. Aiming for these numbers is a sign of a strong, high-growth trajectory.
Interpreting the Numbers
The simplest way to put your growth into perspective is to look at your current ARR. A company at $500K ARR is playing a totally different game than one at $15M ARR. In the early days, massive percentage growth is common and even expected. Later on, the focus shifts to steady, efficient, and durable expansion.
"Private B2B SaaS companies with annual recurring revenue (ARR) of less than $1 million reported the highest median growth rate at 50%, while the largest companies with ARR over $20 million had the lowest median growth rate at 25%."
This really drives home a fundamental truth of scaling a SaaS business: as your revenue base gets bigger, your percentage growth rate naturally slows down. Investors and founders call this "growth endurance," and it's a critical factor in planning for the long term.
As you look through this cheat sheet, it's a great time to also think about specific SaaS growth strategies to scale your business. Benchmarks tell you where you are; a solid strategy shows you how to get where you want to go.
Here’s a quick breakdown to help you gauge your performance at a glance:
- Under $1M ARR: This is the land of hypergrowth. Once you nail product-market fit, you can see absolutely explosive month-over-month and year-over-year growth, often well over 100%.
- $1M - $10M ARR: Things start to stabilize here. Healthy, median growth rates typically land somewhere between 30% and 60%. The top-quartile companies are still growing much faster.
- Over $10M ARR: Predictability is the name of the game. Solid growth is usually in the 20% to 40% range, and you're balancing it carefully with profitability and other efficiency metrics.
Getting a Handle on the Global SaaS Market
Before you can set meaningful growth benchmarks for your own SaaS company, you need a solid grasp of the big picture. The entire Software-as-a-Service market is not just growing—it's picking up speed. This acceleration is fueled by a massive shift to the cloud and the constant pressure on businesses in every sector to modernize their operations.
This isn't just another tech trend. It's a fundamental change in how companies get work done. Everyone, from tiny startups to huge corporations, is ditching old-school, on-premise software for the flexibility and power of SaaS. That shift creates a huge tailwind that can help propel your own growth.
Why B2B SaaS Is in a League of Its Own
The entire SaaS market is hot, but the Business-to-Business (B2B) space is on another level entirely. B2B tools—the ones that help companies manage everything from sales pipelines to payroll—are experiencing explosive demand. This sharp focus on solving specific business problems allows for higher-value products and, as a result, faster growth.
Just look at the numbers. The B2B SaaS market is projected to be worth USD 0.49 trillion in 2026. From there, it’s expected to accelerate at a 26.24% CAGR and hit USD 1.58 trillion by 2031. That growth rate easily outpaces the broader SaaS market, which tells you just how big the opportunity is. You can dig deeper into these numbers in the full report from Mordor Intelligence.
What’s driving this? A growing hunger for specialized, automated tools that untangle complex business challenges, make operations more efficient, and deliver a clear return on investment.
Key Geographic Markets and Where to Look for Growth
Knowing why the market is growing is one thing; knowing where it's growing is another. The global picture isn't uniform. Some regions are well-established leaders, while others are emerging as the new frontiers for growth.
Here’s a quick breakdown of the major players:
- The Dominant Market: North America is still the biggest and most mature SaaS market. It holds the lion's share of the market, thanks to a high adoption rate and a huge number of both SaaS vendors and customers.
- The Fastest-Growing Region: Keep your eye on the Asia-Pacific (APAC) region. It's projected to be the fastest-growing market by far, expanding at an incredible CAGR of 24.60%.
- The Engine in APAC: Much of this growth comes from small and medium-sized enterprises (SMEs) adopting SaaS tools to stay competitive on a global stage.
For founders and investors, this geographical context is crucial. North America offers scale and stability, but emerging markets like APAC present a massive opportunity for rapid growth by tapping into a fresh wave of customers eager for new solutions.
Understanding these global dynamics helps you put your own company’s performance into perspective. Are you fighting for market share in a mature region, or are you riding the wave of new demand in a high-growth area? Answering that question is the first step toward setting growth targets that are both realistic and ambitious.
Essential Growth Benchmarks By ARR Stage
Figuring out SaaS growth benchmarks isn't about chasing one magic number. It's about finding the right number for where your company is right now. The clearest way to do that is by looking at your Annual Recurring Revenue (ARR). A startup just finding its footing should be growing at a completely different clip than a seasoned market leader.
As companies get bigger, their percentage growth rates naturally slow down. It’s a concept we call growth endurance. Hitting 100% year-over-year (YoY) growth is a fantastic goal when you're under $1 million ARR, but trying to pull off that same percentage at $10 million ARR is incredibly rare. This section breaks down the median and top-quartile benchmarks for each key ARR stage so you have clear, realistic targets.
This chart gives a bird's-eye view of the entire B2B SaaS market, showing just how much opportunity is out there.
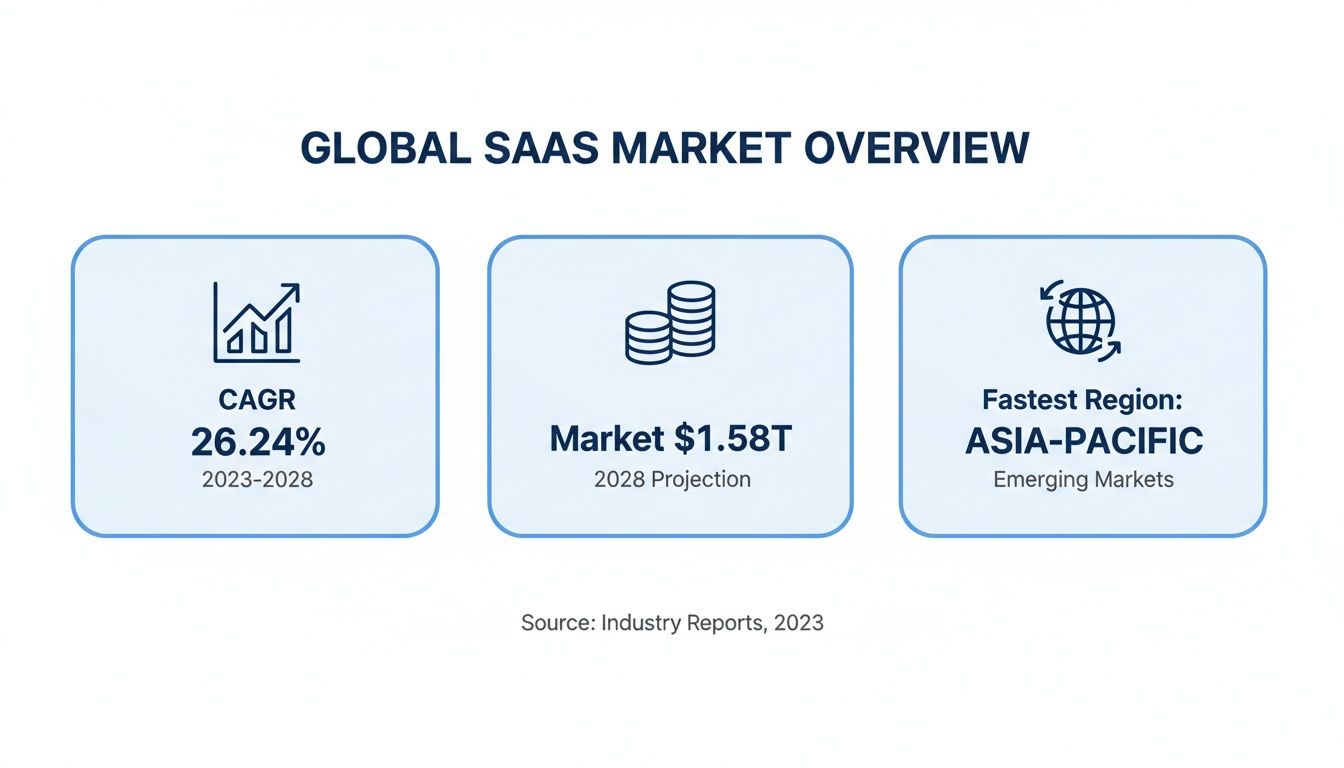
With a projected market size of $1.58 trillion by 2031, it's clear there’s a massive tailwind helping B2B SaaS companies succeed.
Under $1 Million ARR
This is the earliest, and often messiest, stage of the journey. The main goal here is nailing product-market fit. Once you do, growth can feel like a rocket ship. Because your revenue base is small, triple-digit growth isn't just possible—it’s a powerful signal to investors that you're onto something big.
- Median YoY Growth: A solid median growth rate to aim for is around 50%. This tells you that your product is clicking with customers and your early go-to-market efforts are working.
- Top-Quartile Performance: The top 25% of companies in this stage are often blowing past 100% YoY growth. Hitting this level means you're executing exceptionally well and carving out your space in the market.
Example: A SaaS company that grows from $300K ARR to $600K ARR in one year has achieved 100% growth, landing it squarely in that top-quartile group.
$1 Million to $5 Million ARR
Once you cross the $1 million ARR milestone, the game changes. It's no longer just about growth; it's about scalable growth. The real challenge is building repeatable systems for sales, marketing, and customer success that can keep the engine running without everything falling apart. Your percentage growth will naturally slow, but the absolute dollar growth starts to become much more meaningful.
The leap from under $1M to the $1M-$5M ARR stage is a true test of scalability. The scrappy tactics that got you your first million often have to be completely re-engineered to get you to the next five.
The benchmarks here reflect that new reality:
- Median YoY Growth: Most companies in this range see a median growth rate of 40-45%.
- Top-Quartile Performance: The high-fliers are pushing for 70% YoY growth or higher.
Example: A business at $2M ARR aiming to hit $3.4M ARR by year-end would be achieving 70% growth—a clear sign of top-tier performance at this stage.
$5 Million to $10 Million ARR and Beyond
As you cruise past the $5 million ARR mark, predictability becomes just as important as the growth rate itself. The law of large numbers really starts to kick in, making those huge percentage gains much harder to hit. But at this scale, even a "modest" 30% growth can mean millions in new ARR.
For a closer look at the monthly targets that feed into this, you can learn more about how to set goals for your MRR growth rate in our detailed guide.
- Median YoY Growth ($5M-$10M): The median benchmark cools to around 35%.
- Top-Quartile Performance ($5M-$10M): The strongest performers in this bracket are still hitting 50% YoY growth.
- Median YoY Growth (Over $20M): For the largest private SaaS companies, a median growth rate of 25% is the standard, reflecting their scale and market maturity.
How Funding Impacts Growth Expectations
Does taking venture capital money automatically mean you have to grow at a breakneck pace? In a word, yes. Your funding strategy is one of the biggest factors setting your SaaS growth rate benchmarks. Whether you’re bootstrapped or backed by VCs creates two completely different playbooks with their own rules for success.
Venture capital is like dumping rocket fuel into your company's tank. It’s meant for explosive acceleration. That money gets put to work immediately—hiring aggressively, launching ambitious marketing campaigns, and speeding up product development. The aim isn't just steady growth; it's about dominating the market, and investors need a massive return to justify their high-risk bet.
The Two Paths to Growth
The fundamental difference between a bootstrapped and a VC-backed company boils down to capital efficiency versus raw speed. Each approach has its own logic and, therefore, its own set of reasonable growth targets.
- Equity-Backed: These companies are built for speed. It's not uncommon for them to operate at a loss, spending more than 100% of their ARR to fuel growth. The game is all about capturing market share as quickly as possible.
- Bootstrapped: These companies are all about sustainability and profitability. They have to grow using the cash the business generates, which naturally forces a sharp focus on capital efficiency. Growth might look slower, but it's often more resilient and profitable right from the start.
This distinction is everything when you're looking at benchmarks. A bootstrapped company hitting a solid 25% growth rate while staying profitable is a huge win. But for a VC-backed company at the same stage, that same 25% growth might signal trouble to its investors.
Benchmarks in the Real World
Recent data really highlights this dynamic. The median growth rate for public SaaS companies is currently around 30%, a pace that private, equity-backed companies are also hitting. At the same time, bootstrapped businesses are holding their own with a very healthy 25% median growth. It goes to show that while VC funding definitely adds fuel to the fire, building a strong, sustainable business without it is more than possible. You can find more of these SaaS statistics and funding impacts on venasolutions.com.
Example: Imagine two SaaS companies, both at $3M ARR. Company A is bootstrapped, grew 30% last year, and banked a 15% profit margin. Company B is VC-backed, grew 50%, but ran at a 20% loss. In their own contexts, both are succeeding.
If you're thinking about raising capital, you have to understand the pressure that comes with it. To get a better sense of what that world looks like, check out our guide on what to expect from Series A investments. At the end of the day, the right benchmark for your company is entirely dependent on the path you choose.
Calculating and Interpreting Your Growth Rate
Knowing the industry SaaS growth rate benchmarks is one thing, but calculating your own metrics and understanding what they really mean is where the magic happens. This is how you move from just tracking numbers to making smart, strategic decisions. Let’s break down the essential formulas and the context you need to read the story your data is telling.
As your company evolves, the way you look at growth needs to change, too. What matters most in the early days isn't the same as what matters when you're scaling. We'll walk through the key calculations you need to get a clear picture at every stage.
Core Growth Formulas
To see how you stack up against the benchmarks, you need to get comfortable with three core growth metrics. Each one gives you a different perspective, from your immediate speed to your long-term momentum.
Here’s a simple visual to explain the most important formulas.
Essential SaaS Growth Formulas
This table breaks down the most important formulas for calculating SaaS growth, along with a quick note on when each is most useful.
| Metric | Formula | Best Used For |
|---|---|---|
| MoM MRR Growth | ((Current Month MRR - Previous Month MRR) / Previous Month MRR) * 100 |
Tracking short-term velocity and the immediate impact of new initiatives, especially for companies under $1M ARR. |
| YoY ARR Growth | ((Current Year ARR - Previous Year ARR) / Previous Year ARR) * 100 |
Measuring stable, long-term growth and smoothing out monthly volatility. This is the key metric for companies over $1M ARR. |
| CMGR | ((Last Month MRR / First Month MRR)^(1/Number of Months) - 1) * 100 |
Understanding your average compounded monthly growth over a specific period (e.g., 6 or 12 months) to find your true growth trend. |
Consistently applying these formulas is how you can directly compare your performance to the benchmarks we've discussed. If you want to play around with these numbers yourself, you can plug your own data into our handy SaaS revenue calculator.
Interpreting the Story Behind the Numbers
A huge growth rate isn't always a sign of sustainable success, and a slower one isn't necessarily cause for panic. Context—specifically your company’s stage—is everything.
Why high MoM growth can be misleading: Think about it. If you're a startup at $10K MRR, signing one new enterprise client could easily cause a 50% MoM growth spike. That's fantastic, but it’s not repeatable every month. This kind of volatility is why early-stage founders live by MoM growth—it captures momentum—but investors are looking for consistency over a longer horizon.
Why YoY growth becomes the gold standard: Once you cross the $1M ARR mark, your revenue base is much larger. Big monthly swings become less common. Year-over-year growth smooths out the bumps from seasonality or one-off deals, giving you a far more reliable indicator of your company's health and trajectory.
A big part of interpreting your growth is knowing how efficiently you're spending to achieve it. It's not enough to just grow; you have to grow profitably. That's why you should also keep a close eye on your Marketing ROI to make sure your growth investments are actually paying off.
The goal here is to get past simple tracking. Use CMGR to understand your average pace, MoM to see if your recent tactics are working, and YoY to measure your long-term strategic progress. This balanced perspective is what lets you set realistic goals and build a growth engine that lasts.
Metrics Beyond ARR That Define Healthy Growth
Top-line revenue growth always gets the attention, but it doesn't tell the whole story. If you only focus on ARR, you're like a driver obsessed with top speed, ignoring critical things like fuel efficiency or how the car handles. To really get a handle on the quality and durability of your growth, you need to look deeper.
These other metrics reveal how efficiently you’re growing, whether customers actually stick around, and if your business model is solid for the long haul. They’re what separate a flash-in-the-pan from a sustainable, valuable company.
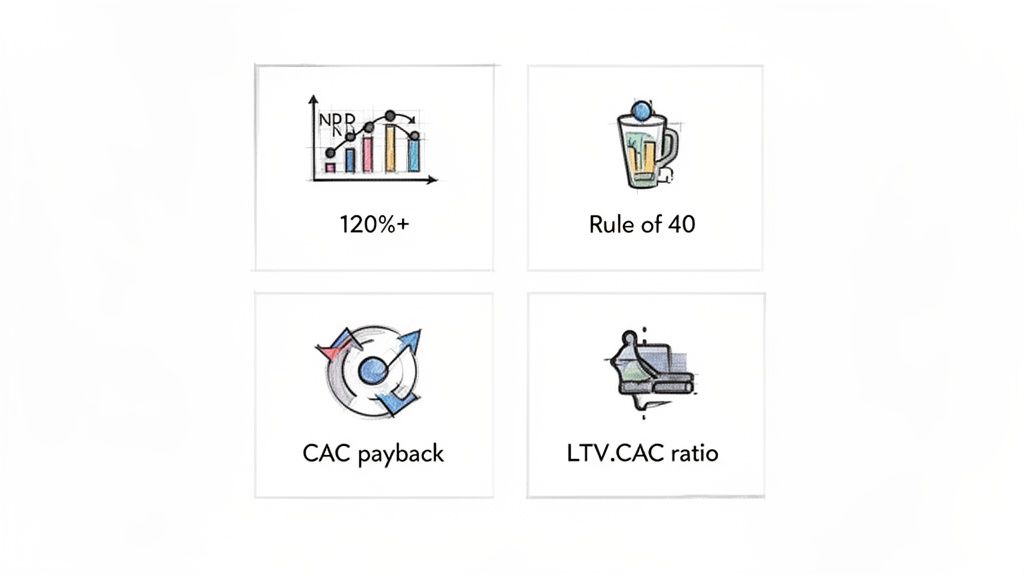
Net Revenue Retention (NRR)
If I had to pick one metric to gauge the health of a SaaS business, it would be Net Revenue Retention (NRR). Also called Net Dollar Retention (NDR), it shows how much revenue you’ve kept from existing customers over a period, accounting for both churn (lost revenue) and expansion (upgrades, add-ons).
An NRR over 100% is magic. It means your existing customer base is a growth engine all on its own, generating more revenue this year than last.
- Good: Hitting 100% NRR is a solid baseline. At this point, your expansion revenue is canceling out your churn.
- Great: Top-quartile companies consistently post NRR of 120% or higher. This is a clear sign of strong product-market fit and happy customers.
- World-Class: The elite public SaaS companies can see NRR north of 130%, which shows they're delivering massive, ongoing value.
The Rule of 40
The Rule of 40 is a classic back-of-the-napkin test for balancing growth with profitability. The formula is beautifully simple: Growth Rate (%) + Profit Margin (%). If you land at 40% or more, you’re generally on a healthy, sustainable path.
What’s great about this rule is its flexibility. An early-stage startup burning cash is perfectly fine if its growth is explosive.
Example: A company growing at 60% with a -20% profit margin easily clears the bar (60 - 20 = 40). On the flip side, a mature business growing at 20% with a 20% profit margin is just as healthy in the eyes of an investor (20 + 20 = 40).
LTV to CAC Ratio
The Lifetime Value to Customer Acquisition Cost (LTV:CAC) ratio gets to the heart of your business model's profitability. It asks a simple question: for every dollar we spend to get a customer, how many dollars do we get back over their lifetime?
A healthy LTV:CAC ratio is widely considered to be 3:1 or higher. Think of it as putting a dollar into your go-to-market machine and getting three dollars back.
If your ratio is dipping below 3:1, it’s a red flag that your sales and marketing might be inefficient. Interestingly, a super high ratio like 8:1 isn't always good news—it could mean you’re underinvesting in growth and leaving money on the table.
CAC Payback Period
Tightly linked to LTV:CAC is the Customer Acquisition Cost (CAC) Payback Period. This metric tells you exactly how many months it takes to earn back the money spent to acquire a new customer. The faster you get your money back, the faster you can reinvest it into acquiring the next customer.
- For SMB-focused models: You really want to aim for a CAC payback of under 12 months.
- For enterprise models: With bigger deals and stickier customers, a payback period of 12-18 months is often perfectly acceptable.
What To Do When Your Growth Misses The Mark
Finding out your growth rate is off from the established SaaS growth rate benchmarks can be a gut-punch. But whether you’re lagging behind or growing so fast your head is spinning, these moments aren't failures. They’re signals, and it's time to take action. This is your diagnostic toolkit for turning that data into a real plan.
If you're falling short of the median benchmark, it’s a clear opportunity to figure out what's holding you back. Don't panic. Instead, it’s time to methodically work through a checklist of the most common growth blockers.
Diagnosing Slow Growth
When growth is sluggish, the real problem is usually something fundamental in your strategy or how you're executing it. Before you throw more money at marketing or sales, dig into these core areas first.
A structured approach helps you find the root cause, not just the symptoms.
- Re-evaluate Product-Market Fit: Does your product still solve a painful problem for a clearly defined audience? Markets shift and customer needs change. Get back on the phone and do a fresh round of customer interviews to make sure your value proposition is still hitting the mark.
- Analyze Your Pricing Strategy: Pricing is one of the most powerful levers you have for growth. If you haven't touched it in years, there’s a good chance it’s misaligned with the value you’re providing. You could test new tiers, explore usage-based models, or simply adjust your entry point to better match specific customer segments.
- Audit Your Marketing and Sales Channels: Are you still pouring resources into channels just because they worked two years ago? A channel that was once a goldmine can easily become saturated or less effective over time. It's crucial to double down on what’s working now and have the discipline to cut what isn’t.
Sometimes, slow growth isn't a sign of a bad product but a disconnect between the product and its market. A brilliant solution for the wrong audience will always struggle to gain traction.
Managing Hypergrowth Sustainably
On the flip side, you might be experiencing hypergrowth—growing much faster than even the top-quartile benchmarks. While this sounds like a champagne problem, it can absolutely break your company if you aren't ready for it. Unmanaged hypergrowth is a direct path to team burnout, a terrible customer experience, and crippling technical debt.
Scaling sustainably means you have to deliberately invest in the foundation of your company.
- Invest in Infrastructure: Your tech stack has to be able to handle the load. Be proactive here. Scale your servers, optimize your database, and invest in systems that can actually grow with you. A major outage at this stage can kill your momentum instantly.
- Scale Customer Support: More customers means more support tickets. It's that simple. Hire and train your support team before they're drowning. This is also the time to implement better tooling, build out a comprehensive knowledge base, and create systems to manage customer feedback at scale.
- Strengthen Your Team and Culture: Hiring quickly can easily dilute the culture that got you here. You have to be incredibly intentional about your hiring process, take the time to onboard new people properly, and over-communicate your mission and values to keep everyone pulling in the same direction.
Answering Your Top Questions About SaaS Growth
When you start digging into SaaS growth rates, a lot of questions pop up. It doesn't matter if you're a founder trying to set next year's targets, a marketer proving your worth, or an investor sizing up a new deal—you need clear answers.
This section gets right to the point, tackling the most common questions we hear. Think of it as a quick reference to help you put all these benchmarks into practice.
What Is The 'T2D3' Growth Path And Is It Still Relevant?
You've probably heard of T2D3. It's shorthand for "Triple, Triple, Double, Double, Double," a legendary growth path where a startup triples its ARR for two straight years, then doubles it for the next three. For a long time, this was the holy grail for VC-backed companies shooting for that coveted billion-dollar valuation.
But is it still the standard? Not really. While it’s a great story, T2D3 is an outlier, not a realistic goal for most. The "growth at all costs" mindset has cooled, and today's investors often value sustainable, efficient growth far more. A much better approach is to aim for the median and top-quartile benchmarks relevant to your current ARR stage.
How Often Should I Track My Growth Rate Against Benchmarks?
This really depends on how big you are. The right rhythm for tracking changes as you scale.
- Under $1M ARR: At this early stage, you live and die by Month-over-Month (MoM) growth. It’s your most immediate signal. You can see how a new campaign or sales hire is working almost in real-time, which lets you make changes on the fly.
- Over $1M ARR: Once you have some scale, MoM numbers can get jumpy. A single large deal or a slow holiday month can throw things off and cause panic. This is when you should shift your main focus to quarterly and Year-over-Year (YoY) growth rates for a more stable, strategic view.
A solid routine is to review your numbers against industry benchmarks every quarter. It's the perfect cadence for strategic planning—frequent enough to stay on track, but not so frequent that you're just reacting to noise.
Can A Low Growth Rate Ever Be Acceptable In SaaS?
Yes, absolutely. Context is everything. What looks "low" for one company might be an incredible achievement for another.
Example: Imagine a bootstrapped company in a specific niche that’s highly profitable. For them, a consistent 20-25% annual growth is a massive win. It’s sustainable and builds real value. Now, take that same growth rate and apply it to a startup that's burning through venture capital in a market where the winner takes all. For them, 20% growth would set off alarm bells for their investors. Your growth rate always has to be measured against your business model, your market, and how you're funded.
How Does Net Revenue Retention Fit Into Growth Benchmarks?
Net Revenue Retention (NRR) is the secret ingredient behind healthy growth. It tells you about the quality of your revenue. A high NRR, especially anything over 100%, means your existing customers are sticking around and spending more over time. It's like having a growth engine built right into your customer base.
This makes hitting your overall ARR targets so much easier and cheaper. Think about it: a company with 120% NRR already has a 20% growth tailwind before they even sign a single new customer. To hit a 50% YoY growth goal, they need much less new business than a company with a leaky bucket 90% NRR. It's no surprise that top-quartile companies often boast NRR figures north of 120-130%.
Ready to stop guessing and find a SaaS idea with proven market demand? Proven SaaS analyzes millions of ads to show you what's already working. Find your next profitable venture at https://proven-saas.com.
Build SaaS That's
Already Proven.
14,500+ SaaS with real revenue, ads & tech stacks.
Skip the guesswork. Build what works.
Trusted by 1,800+ founders