
Choosing the Best SaaS Business Intelligence Tools
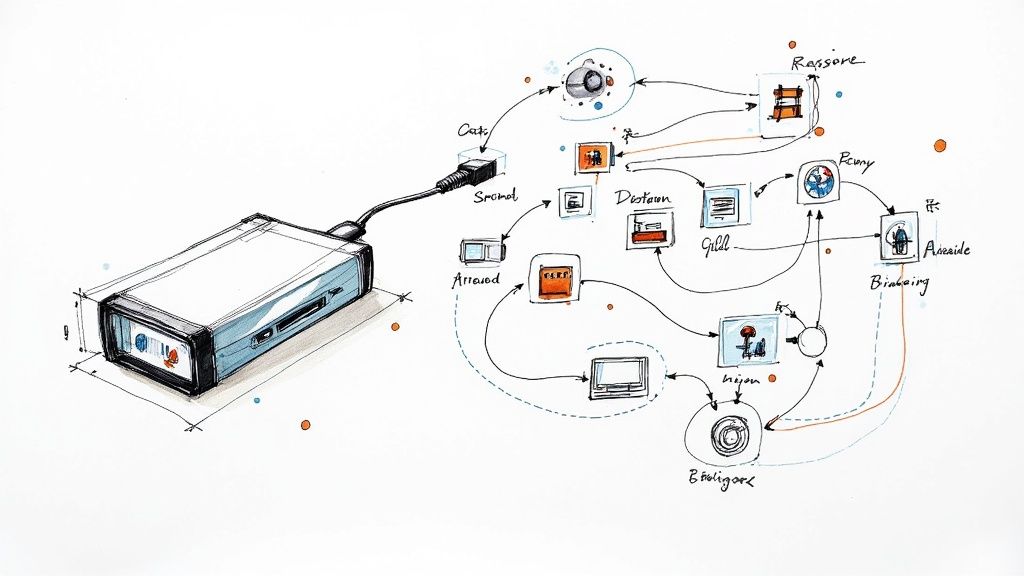
Think of all your company's data—from sales, marketing, and finance—as separate streams of information. A SaaS Business Intelligence (BI) tool acts like a reservoir, collecting all those streams into one central place.
But it doesn't just store the data. It filters it, analyzes it, and presents it through an interactive dashboard. This turns raw numbers into clear charts, graphs, and insights that anyone on your team can understand and act on.
For example, a marketing manager can see which ad campaign is generating the most paying customers, not just clicks. A sales leader can instantly see which products are most profitable in which regions. It's about turning data into direct answers.
What Are SaaS Business Intelligence Tools?
At their core, SaaS BI tools are cloud-based platforms. This is a huge shift from the old way of doing things, where you'd have to buy, install, and maintain expensive software on your own servers.
With a SaaS model, everything is online. You just log in through a web browser. This makes powerful data analytics accessible to everyone, from startups to enterprise teams, without needing a massive IT budget or a server room. It’s all managed for you, typically for a predictable monthly fee.
The goal is to stop relying on gut feelings and tangled spreadsheets. These tools automatically pull all your information together, giving everyone a single, reliable view of what's really happening in the business.
The Cloud-First Advantage
It's no surprise that the cloud is the new standard. In fact, cloud-based BI now makes up about 66% of the market share in 2024, a trend that's only growing. You can dig into the specifics of this shift over at Mordor Intelligence.
This move to the cloud is a game-changer. As your company grows and your data piles up, a SaaS platform scales with you. There's no need to buy more hardware or worry about maintenance—it just works. This flexibility is key to their popularity. If you're looking to spot these kinds of opportunities, our guide on SaaS market research is a great place to start.
> The magic of SaaS BI is that it puts data into everyone's hands. It's no longer locked away with data scientists. Marketing managers, sales reps, and CEOs can all see the same picture and make smarter, faster decisions.
Visualizing the Insights
So, what does this look like in practice? Here’s a perfect example of a BI dashboard in action. This single screen tells a clear story.
At a glance, you can immediately see sales trends, which states are most profitable, and how different products are performing. It’s the difference between reading a dense report and seeing the full story in a single, clear picture.
Why Data-Driven Decisions Are Now Essential
Let’s be clear. Running a business on gut feelings today is like trying to navigate a new city without a map. The most successful companies have already moved on, replacing intuition with strategies grounded in real, up-to-the-minute data.
This isn't a passing trend; it's the new standard for staying competitive. And what’s making it all possible? The explosion of the SaaS market, which has put powerful analytics tools within reach for everyone. SaaS business intelligence tools are the engines behind this shift, giving companies of all sizes a clear view of what's actually happening under the hood.
The Growing Pressure to Compete with Data
These days, the pressure is on. You need to understand your customers, see market shifts coming, and run your operations as efficiently as possible. Guesswork is expensive—it leads to wasted budgets and missed opportunities.
Data-driven companies, on the other hand, can pinpoint exactly which marketing campaigns bring in the best customers. They can identify operational bottlenecks before they cause a crisis. This urgency is reflected in the market size; the global business intelligence market hit around USD 41.74 billion in 2024 and is projected to soar past USD 151.26 billion by 2034, according to a detailed Precedence Research report.
> The core idea is simple: companies that use data to make smarter, faster decisions will win. SaaS BI platforms provide the framework to turn raw information into a genuine competitive advantage.
This infographic paints a clear picture of the forces driving this change.
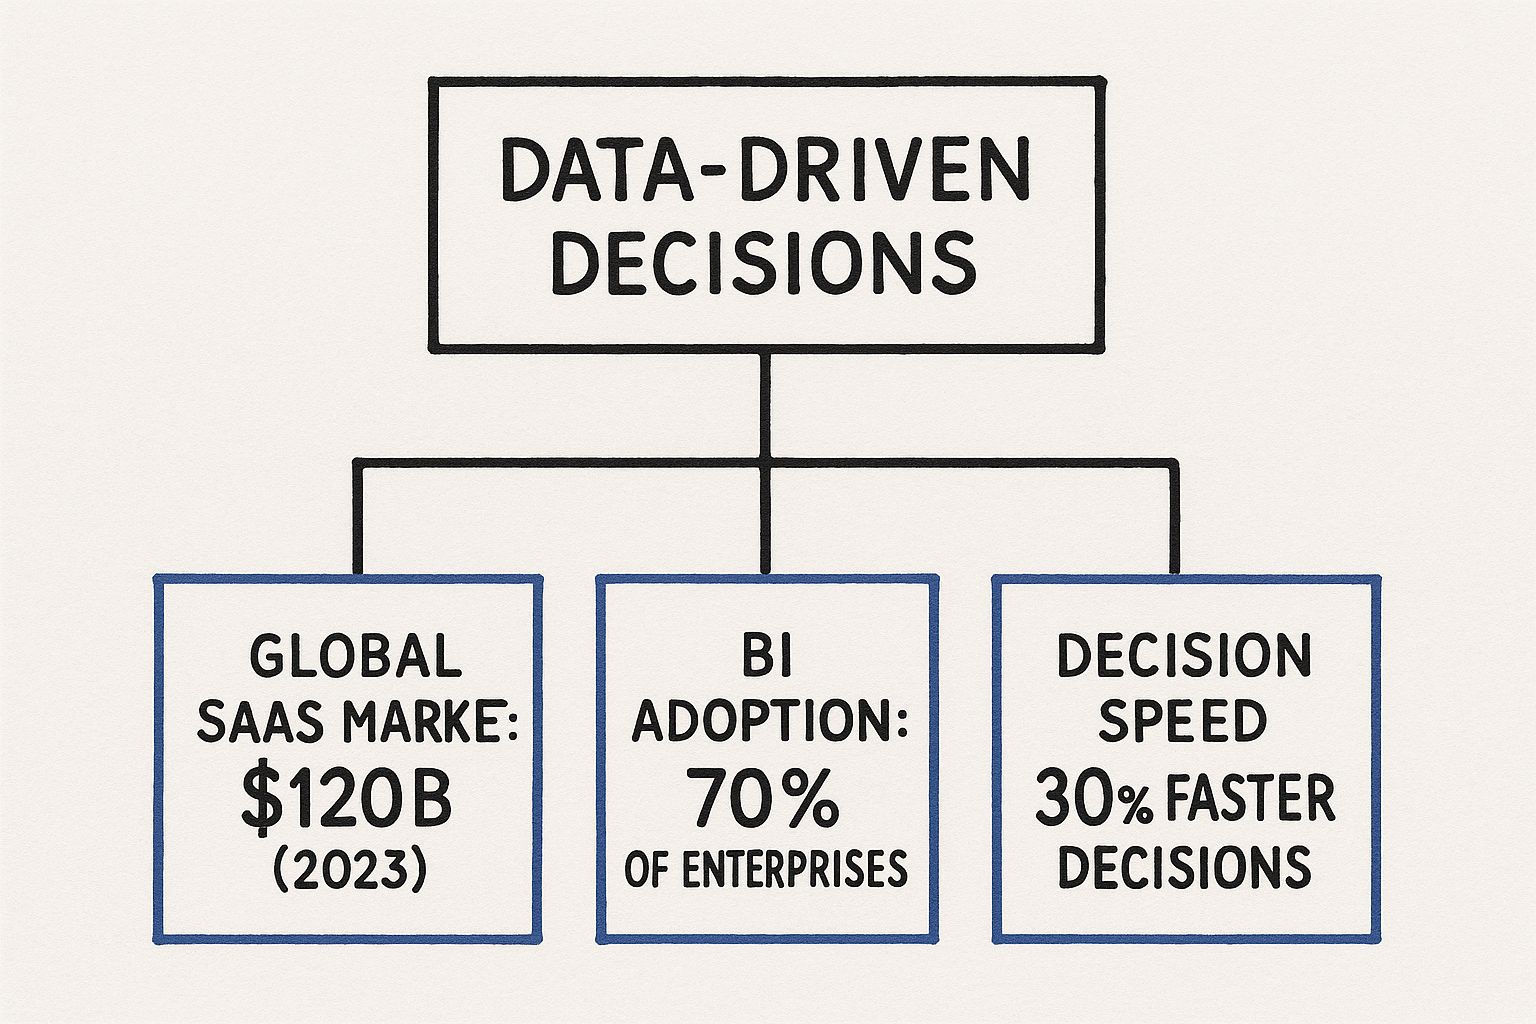
You can see the direct line connecting the massive SaaS market to real-world benefits, like making critical decisions significantly faster.
Turning Insights into Actionable Strategy
Getting data is one thing. Using it to outsmart the competition is another. Modern SaaS BI tools shine by closing this gap, making complex data easy for anyone on the team to understand and act on.
Here are some real-world examples:
- A marketing team can see ad spend versus customer acquisition costs in real-time. If LinkedIn ads are generating higher-value customers than Facebook ads, they can shift their budget instantly, not next month.
- A sales manager gets a visual of their team's pipeline, helping them spot at-risk deals. For example, they might see that deals are stalling after the initial demo and decide to add a follow-up call to the process.
- An operations lead can monitor inventory across different warehouses. This helps prevent stockouts of popular items and reduces costs from overstocking slow-movers.
In each case, the team moves from reacting to problems to proactively shaping their strategy. A shared view of performance gets everyone on the same page. If you're aiming for that kind of clarity, our guide on conducting a SaaS competitive analysis is a great resource.
What to Look for in a SaaS BI Tool
Choosing the right SaaS business intelligence tools can feel overwhelming. They all promise to deliver insights, but it’s the features under the hood that make the difference. To cut through the noise, focus on the core capabilities that actually turn data into a competitive advantage.
Think of the following as a practical checklist. Each feature solves a specific business problem and helps your team make smarter, faster decisions.
Seamless Data Connectors
Your data is scattered everywhere—in your CRM, accounting software, and marketing platforms. A great BI tool must bring all of that together easily. That’s where data connectors come in.
Think of them as universal adapters for your data. A good adapter lets you plug your laptop into an outlet in any country. Similarly, strong data connectors let your BI platform plug into any data source, pulling everything into one central place for analysis.
For instance, you could connect your sales data from Salesforce with your marketing data from Mailchimp to see exactly which email campaigns are generating the most profitable customers. Without that connection, you're just looking at two separate pieces of a much larger puzzle.
Interactive and Intuitive Dashboards
A static report is a snapshot in time, but business moves fast. Modern BI demands interactive dashboards that let you explore your data in real-time.
This feature is like a touchscreen in a car. You don’t just see your speed; you can tap the screen to get directions or change the music. An interactive dashboard lets you click on a chart, drill down into the details, and ask follow-up questions on the fly.
> The real power here is that it fuels curiosity. It encourages your team to ask "why?" when they see a surprising number. For example: "Why did sales dip in the West region last month?" A single click on that region can instantly filter every other chart on the dashboard to help you find the answer.
Powerful Data Visualization
Humans are visual creatures. We understand charts and graphs far more easily than massive spreadsheets. Effective data visualization is all about telling a clear, compelling story with your data.
A top-tier SaaS BI tool will offer a library of visualization options, from simple bar charts to complex heat maps. This isn't just about making things look pretty; it’s about choosing the right visual to make an insight impossible to ignore. A line chart is perfect for showing a trend over time, while a map can instantly reveal your top-performing sales territories.
Automated Reporting and Alerts
Manually pulling reports every week is a tedious chore prone to human error. One of the biggest wins with SaaS BI is the ability to put this process on autopilot.
Imagine setting up a sales performance report once and having it automatically land in your team's inbox every Monday morning. That's what automated reporting does—it ensures everyone has the latest information without anyone lifting a finger.
Even better are automated alerts. These are like smoke detectors for your key business metrics. You can set a rule to get a notification if your customer churn rate suddenly jumps above 5% or if a landing page's conversion rate drops by 20%. This lets you react to problems the moment they happen, not a week later.
AI and Machine Learning Insights
The most advanced SaaS BI platforms now include AI-powered features that actively help you find insights you might have missed. This is where the tool shifts from being a passive dashboard to an active analytical partner.
For example, AI can automatically spot an anomaly, like a sudden drop in user engagement from a specific city, and flag it for you. For teams without a dedicated data scientist, this is a massive advantage.
---
To make it clearer, here’s a simple breakdown of these essential features and the value they bring.
Essential SaaS BI Tool Features Explained
| Feature | Simple Explanation | Business Benefit |
|---|---|---|
| Data Connectors | Plugs that pull data from all your different software into one place. | Get a complete, unified view of your business instead of siloed information. |
| Interactive Dashboards | Clickable reports that let you drill down into the data. | Empowers anyone to explore data and answer their own questions without needing an analyst. |
| Data Visualization | Turns numbers into easy-to-understand charts, graphs, and maps. | Makes complex data insights instantly clear and shareable across the organization. |
| Automated Reporting | Schedules reports to be created and sent out automatically. | Saves dozens of hours of manual work and ensures consistent, timely updates for everyone. |
| Automated Alerts | Notifies you when a key metric goes above or below a set threshold. | Enables you to react to opportunities and threats in real-time, not after the fact. |
| AI-Powered Insights | Uses AI to automatically find trends, anomalies, and patterns in your data. | Uncovers hidden insights that human analysts might miss, accelerating decision-making. |
Ultimately, the best tool has a healthy mix of these capabilities. They work together to create a platform that doesn't just show you what happened, but helps you understand why it happened and what to do next.
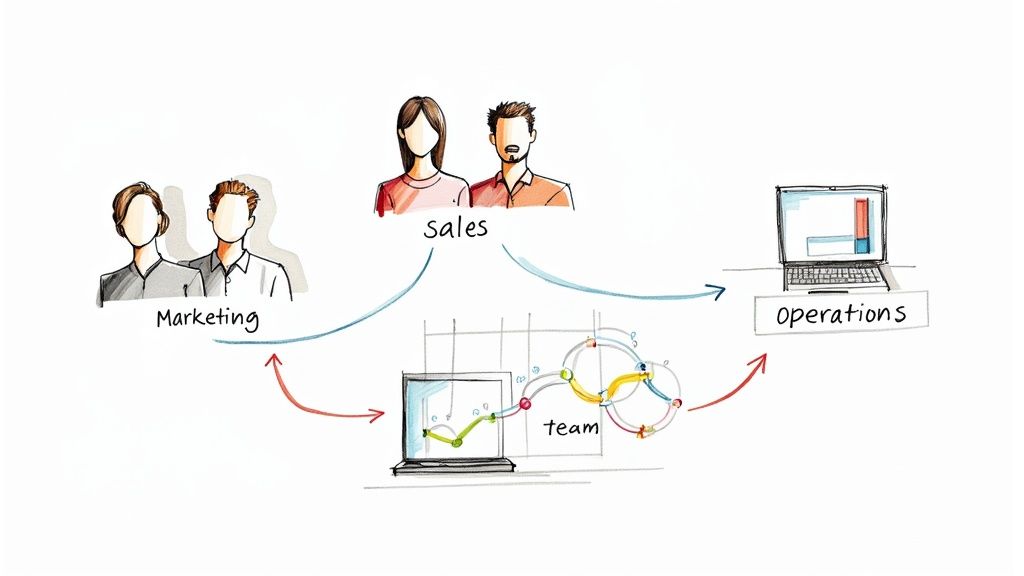
How Different Teams Use BI to Fuel Business Growth
The real value of SaaS business intelligence tools isn’t in a feature list—it’s in the results they help create. When different departments can actually see their performance, they stop guessing and start making strategic moves. These platforms give every team a clear line of sight into how their work directly impacts the company's bottom line.
Think of it this way: without a central BI tool, each department is using its own separate map. A SaaS BI platform gives everyone the same live, interactive GPS, ensuring the entire company is moving together in the right direction.
Marketing Teams: Turning Clicks into Customers
For marketers, the goal is simple: get high-quality leads without burning the budget. A good SaaS BI tool connects the dots between ad spend and actual revenue.
Imagine a marketing manager running campaigns on Google Ads, LinkedIn, and Facebook. With a BI dashboard, they can see in real-time:
- Cost Per Acquisition (CPA) for every channel.
- Customer Lifetime Value (CLV) tied back to the specific campaigns that brought them in.
- Lead-to-customer conversion rates in a simple, visual funnel.
When the dashboard clearly shows that LinkedIn ads bring in customers with a 3x higher CLV than Facebook ads, the manager doesn't have to wait for a meeting. They can shift their budget on the spot. This agility turns a marketing department from a cost center into a reliable revenue engine.
Sales Teams: Forecasting with Confidence
A sales team lives and dies by its pipeline. Spreadsheets quickly become a tangled mess of stale data. Visualizing that pipeline in a SaaS BI dashboard gives sales leaders the clarity they need to drive performance.
A sales manager can use their dashboard to:
- Track quota attainment for every rep in real-time, avoiding end-of-quarter surprises.
- Spot pipeline bottlenecks and see exactly where deals are getting stuck.
- Analyze win/loss rates by region, product, or competitor.
For example, a manager might discover that a top-performing rep closes deals 20% faster than the team average. By drilling down, they see this rep focuses heavily on early-stage product demos. Just like that, they have an actionable insight they can roll out as a best practice for the whole team.
> A well-designed sales dashboard doesn't just show you numbers; it tells a story. It reveals who is winning, why they're winning, and how you can replicate their success.
With sales, profit, and regional data all in one place, you can instantly spot trends—like which products are most profitable or which channels are bringing in the big deals.
Operations Teams: Getting Ahead of Problems
For any operations team, efficiency is key. Whether you're managing a supply chain or inventory, small delays can snowball into major disruptions. A SaaS BI tool provides the visibility needed to catch potential problems before they happen.
Picture an e-commerce company using a BI platform to monitor its supply chain. The operations manager can track:
- Supplier Lead Times: Is a key supplier consistently late? The dashboard will flag that trend immediately.
- Inventory Levels: Is one warehouse about to run out of a popular item while another is overstocked? The data makes that imbalance clear.
- Shipping Performance: Which carrier delivers on time most consistently for the best price?
- Per-User Pricing: You pay a set fee for each person using the tool. Simple and predictable, but costs can climb as you add more people.
- Usage-Based Pricing: Your bill is based on how much data you process. This can be great if you have many casual users.
- Tiered Plans: These bundle features at different price points. Pay close attention to which features are in the more expensive tiers.
- What are our top 3 customer acquisition channels based on lifetime value?
- A bar chart ranking your products from highest to lowest profit margin.
- A pie chart showing how much total profit each product contributes.
- A simple table with the raw numbers for reference.
- Your Team Size: Most tools charge per user, per month.
- The Features You Need: Basic reporting costs less than advanced features like AI-driven predictions.
- How Much Data You're Using: Some pricing models scale with your data volume.
By setting up an automated alert for when inventory on a bestseller drops below a 14-day supply, the team can reorder proactively. This simple, data-driven workflow prevents stockouts, keeps customers happy, and protects revenue. These examples show how SaaS business intelligence tools become core drivers of growth and efficiency for every single team.
How to Choose the Right SaaS BI Solution
https://www.youtube.com/embed/1e6CZ16e4f8
Diving into the market for SaaS business intelligence tools can be overwhelming. There are so many options, and it’s easy to get sidetracked by flashy features. But the best tool isn't the one with the most bells and whistles. It's the one that solves your specific problems.
The selection process is less about tech and more about strategy. Before scheduling a demo, ask a simple question: "What business pain are we trying to fix?" Are you losing customers and don't know why? Is your marketing budget disappearing? Are your sales forecasts just a guess?
Nailing down your primary goal acts as an instant filter. It forces you to evaluate tools based on their ability to deliver real value.
Don't Buy a Tool Only a Data Scientist Can Use
A common mistake is choosing a BI tool that’s powerful but requires a PhD to operate. If your team needs to write code just to get a simple answer, the platform will end up collecting dust. The point is to empower people, not create another data bottleneck.
Think about the people who will use this tool every day. Is the interface intuitive? Does it have a simple drag-and-drop feature? Can a sales manager figure out their team's performance without a technical manual? Always look for platforms designed for business users, not just analysts. That's the key to getting everyone on board.
Make Sure It Plays Well with Your Other Software
A BI tool is only as good as the data it can access. Your company’s data is likely scattered across a dozen systems—your CRM, accounting software, and marketing platforms. The right solution must connect to all these sources without a fuss.
Before you get too far with any vendor, make a list of your must-have integrations. Check if the tool has pre-built connectors for the software you already use. A platform with strong integration capabilities saves you time and money, letting you see the full picture from day one.
Plan for Tomorrow, Not Just Today
Your data is growing, and fast. The tool you pick today needs to handle the data you’ll have tomorrow. Scalability isn't just a buzzword; it's what determines if this is a long-term solution or a short-term fix.
> A scalable SaaS BI solution grows with you. As you add more data sources and users, the platform should maintain its performance without a sudden, dramatic price hike.
This is where the SaaS model shines. The global SaaS market is on track to hit USD 1.25 trillion by 2034, largely because these platforms offer flexible, scalable solutions. This growth fuels a steady stream of powerful and accessible SaaS business intelligence tools. You can discover more insights about SaaS market growth on hostinger.com to get a better sense of the market.
Understand How You'll Be Charged
Finally, let's talk about money. You need a tool that fits your budget as your company grows. SaaS BI pricing comes in a few different flavors.
To keep everything straight, use a checklist to compare your options. This simple framework ensures you're asking the right questions.
Key Evaluation Criteria for Your Next BI Tool
| Criteria | What to Ask | Why It Matters |
|---|---|---|
| Business Problem Fit | Does this tool directly address our top 1-2 business challenges? | Avoids buying a feature-rich tool that doesn't solve your core pain points. |
| Ease of Use | Can our non-technical team members build their own reports? | High user adoption is key to ROI. If it's too complex, no one will use it. |
| Integrations | Does it have pre-built connectors for our key systems (e.g., Salesforce, QuickBooks)? | Seamless integration saves you from costly and time-consuming custom development work. |
| Scalability | How does the tool handle a 10x increase in data volume or users? What's the cost? | Your tool needs to grow with your business without performance issues or surprise fees. |
| Pricing Model | Is it per-user, usage-based, or tiered? What will our total cost be in year two? | Predictable costs are crucial. Hidden fees or pricing that punishes growth can kill your budget. |
| Support & Training | What level of customer support is included? Do they offer onboarding help? | Good support ensures you get value from the tool quickly and can resolve issues without delay. |
By thinking through these points, you move from just buying software to making a strategic investment. Common pricing models include:
Always ask for a detailed pricing breakdown. To see how your top choices stack up, check out our guide on completing a competitive landscape analysis. Getting this clarity upfront means no nasty surprises down the road.
Your First Steps to Data-Driven Success
Getting started with a SaaS business intelligence tool can feel overwhelming. The secret? Don't try to do everything at once. Focus on getting one quick, tangible win. This proves the tool's value and builds the momentum you need.
The biggest mistake is trying to connect every data source and build a dozen complicated dashboards from day one. That approach leads to burnout. A smarter way is to aim for one clear victory.
Step 1: Start with a Single, High-Value Question
Before you connect any data, gather your team and ask: "What's one thing we could know right now that would make a real difference to the business?" Your goal is to find a specific, high-impact problem to solve first.
Good starting questions are focused and lead to action. For example:
Which of our products actually* have the best profit margins?
Which marketing campaign from last quarter brought in the most qualified* leads?
Focusing on a single question gives your project a clear purpose. It turns a vague idea like "let's analyze our data" into a focused mission.
Step 2: Connect Only the Essential Data
Once you have your question, figure out the absolute minimum data you need to answer it. For example, to find product profit margins, you don't need social media stats yet. You only need two things: your sales data and your cost of goods sold (COGS) data.
Resist the temptation to connect everything. Throwing too much information into your BI tool at the start just creates noise. By connecting only what’s essential, you simplify the process and get to your first insight much faster.
> The point of your first project is speed to value. By narrowing the scope to one question and only the necessary data, you drastically shrink the time it takes to see a real return.
Step 3: Build One Simple, Clear Dashboard
Now that you have your focused question and essential data, build a single dashboard that answers that one question—and nothing more. The goal here is clarity, not complexity.
Let's stick with the product profit margin example. Your dashboard might only need a few simple visuals:
That's it. This clean dashboard gives your team a valuable answer they can grasp in seconds. This first small victory is incredibly powerful. It builds confidence, gets people excited, and turns a daunting project into an empowering first step toward becoming a truly data-driven company.
Got Questions? We've Got Answers
Even with the best guide, a few questions always pop up. Let's tackle some of the most common ones about SaaS BI tools.
Is My Company's Data Actually Safe in a SaaS BI Tool?
This is a valid concern. The good news is that top-tier SaaS providers live and breathe security. They often have security budgets and teams far beyond what a single company could manage on its own.
Your data is encrypted when it leaves your systems and stays encrypted while stored. These companies also follow strict global standards like SOC 2 and GDPR. Plus, they're typically built on hyper-secure platforms like AWS or Google Cloud. Always ask for their security and compliance documents—any serious provider will have them ready.
Will I Need to Hire a Data Scientist Just to Use This Thing?
Absolutely not. One of the main reasons these tools exist is to get data into the hands of everyone, not just tech experts. Modern SaaS BI platforms are built with business users in mind, featuring drag-and-drop dashboards and intuitive templates.
A marketing manager, for example, can build a report on campaign performance without touching a line of code. While a data scientist can dig deeper, these tools empower your team to get quick answers to everyday business questions.
> The point of modern SaaS business intelligence tools is to make data accessible. They're designed to give the people making the daily decisions the power to find their own answers.
What Should I Expect to Pay for a SaaS BI Tool?
The price can vary quite a bit, depending on a few key factors:
A small team could get started for a few hundred dollars a month, while an enterprise solution might run into the thousands. The smartest move is to use the free trials. Nearly every tool offers one. This lets you test if it actually solves your problems before you commit.
---
Ready to stop guessing and start building? Proven SaaS gives you an unfair advantage by showing you which SaaS ideas are already profitable. We analyze ad spend to reveal validated markets with real demand, so you can build with confidence. Find your next profitable SaaS idea today.
Build SaaS That's
Already Proven.
14,500+ SaaS with real revenue, ads & tech stacks.
Skip the guesswork. Build what works.
Trusted by 1,800+ founders