
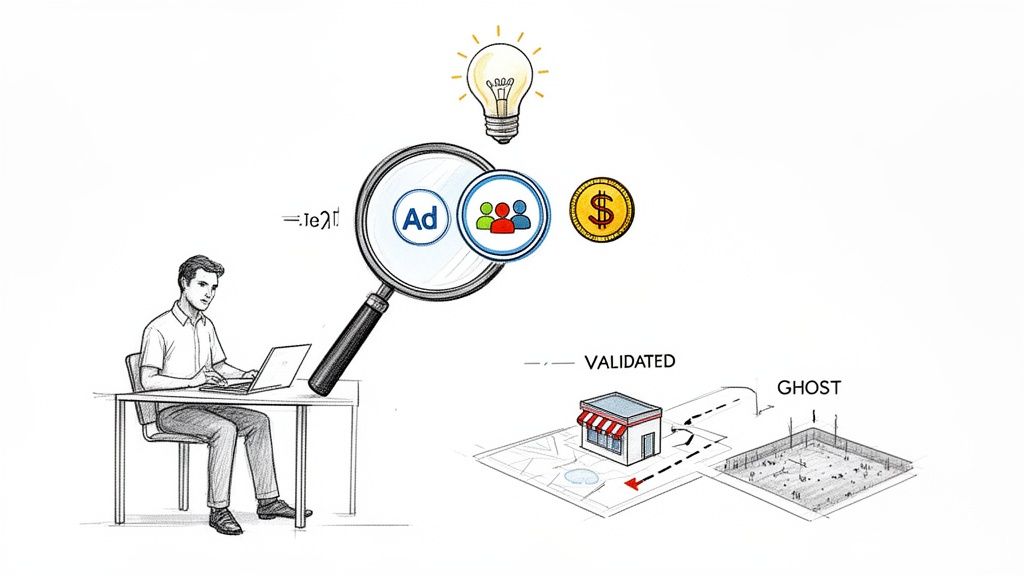
To get a handle on a competitor’s revenue, you have to become a bit of a detective. You’re looking for public signals—things like consistent ad spend, hiring sprees, and website traffic. By reverse-engineering these clues with some solid industry benchmarks, like a 4-5x return on ad spend (ROAS) for a typical SaaS business, you can piece together a surprisingly accurate revenue model without ever peeking at their private books. It’s all about turning public data into a powerful tool for market validation.
Why Estimating Competitor Revenue Is a Founder's Superpower
We’ve all heard the story, maybe even lived it: a founder grinds away for six months, building what they believe is the perfect product, only to launch to the sound of crickets. The "build it and they will come" philosophy is a classic, and often costly, mistake. It completely skips the most important step—making sure customers actually exist and are willing to pay for what you’re building.
This is exactly why learning to estimate competitor revenue is a founder's superpower. It forces you to stop building in a vacuum and start strategically hunting for where the customers already are. Instead of just guessing, you're using real-world signals to de-risk your idea before a single line of code gets written.
From Guesswork to Educated Estimates
The big idea here is simple: you can build a reliable financial picture of a private company by following the breadcrumbs they leave all over the internet. This isn't about finding one single magic number. It's about layering different data points on top of each other until a confident revenue range emerges.
Think of yourself as an investigator. A competitor's consistent, high-budget ad campaign is a massive clue. Nobody burns that kind of cash month after month unless it's bringing in a positive return. That sustained spending is one of the clearest signs I've seen of a solid product-market fit and a profitable customer base.
Validating Your Niche with Public Data
For SaaS founders and indie hackers, this approach is a game-changer. A great place to start is by digging into ad spend, especially on platforms like Meta, where transparency laws force companies to show their hand. The global SaaS market is a beast—expected to hit $315.68 billion in 2025 and projected to soar to $1,482.44 billion by 2034. You can find more details on this incredible growth from Fortune Business Insights.
In a market that crowded, you need data to survive. Since early-stage SaaS companies often pour 40-60% of their revenue back into sales and marketing, a competitor's ad budget is a direct window into their financial health.
Key Takeaway: If you see a competitor consistently spending over $50,000 a month on ads for six months or more, you can conservatively assume they're pulling in somewhere between $200,000 and $500,000 in monthly revenue. This is based on a standard 4-5x return on ad spend.
This simple bit of math turns a competitor’s ad budget from a vanity metric into a concrete validation signal. It tells you a market doesn't just exist—it's profitable enough to fuel major marketing investments. Throughout this guide, I’ll walk you through a repeatable workflow to spot these opportunities and sidestep those expensive mistakes, turning competitor analysis into your strategic advantage.
Cracking the Code: How to Estimate Revenue from Ad Spend
Alright, let's get down to business. Theory is great, but actionable intel is better. One of the most solid public signals you can use to ballpark a competitor's revenue is their ad spend. Thanks to transparency rules, platforms like the Meta Ad Library are a goldmine. The trick isn't just seeing a flashy ad; it's about spotting consistent, long-term spending.
Think about it: no sane company pours thousands of dollars into ads month after month unless it's working. That sustained investment is a massive tell—it signals product-market fit and, more importantly, a steady stream of revenue.
The Back-of-the-Napkin Formula
To make this practical, we can use a simple formula to work backward from ad spend to a revenue estimate. It's a quick and repeatable way to get a baseline for your analysis.
Here's the basic math:
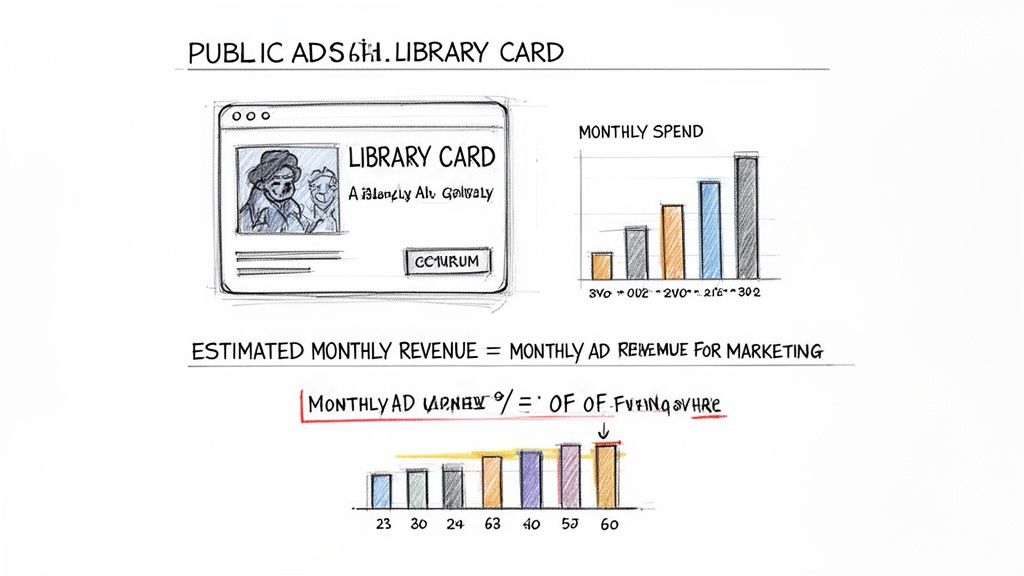
Estimated Monthly Revenue = Monthly Ad Spend / % of Revenue for Marketing
This works because for most SaaS companies, the marketing and sales budget is a fairly predictable chunk of their total revenue. A good rule of thumb, especially for companies in a growth phase, is anywhere from 40% to 60% of revenue getting plowed back into customer acquisition.
A Real-World Example: 'ProjectPal'
Let's cook up a fictional competitor, we'll call them 'ProjectPal'. You've been keeping an eye on their ads in the Meta Ad Library for a few months and notice they're always running a handful of different campaigns. Using a tool to estimate their spend, you figure they're putting about $20,000 a month into Facebook and Instagram.
Now, let's plug that into our formula. We'll start with a conservative assumption that ProjectPal puts 40% of its revenue toward marketing.
- Monthly Ad Spend: $20,000
- Marketing Budget %: 40% (which is 0.40)
Here's the calculation: $20,000 / 0.40 = $50,000
Just like that, you have a reasonable estimate: ProjectPal is likely pulling in around $50,000 in Monthly Recurring Revenue (MRR). This simple reverse-calculation gives you a surprisingly clear picture using only public information.
The Meta Ad Library is your starting point, giving you a direct look at what they're running.
This view lets you see their creative, copy, and how long their campaigns have been active, which is a direct window into their marketing playbook.
Consistency Beats Intensity
A one-off, high-spend campaign doesn't mean much. It could just be a well-funded startup testing the waters or a big push for a new feature. The real signal is consistent spending over 3 to 6 months.
My Two Cents: I always focus on competitors who either maintain or slowly increase their ad spend quarter over quarter. This is a huge indicator that their customer acquisition cost (CAC) is profitable and their lifetime value (LTV) makes the continued investment a no-brainer.
This long-term commitment is what separates a fleeting experiment from a well-oiled, revenue-generating machine. That's the data point telling you they've found a profitable channel they're ready to scale. For a deeper dive, you can play around with our Facebook Ad Spend Estimator.
Fine-Tuning Your Assumptions
Of course, this whole model hinges on that marketing budget percentage. While 40% is a solid starting point, you can get smarter about it:
- Early-Stage Startups: These guys might be spending way more aggressively, maybe closer to 60% or even higher, especially if they're VC-backed and chasing growth.
- Established Players: A more mature company might have a leaner budget, perhaps around 20-30%, because they're coasting on brand recognition and organic traffic.
This kind of analysis is getting more sophisticated every day. Ad library pattern recognition, often with a bit of AI, is turning public Meta data into surprisingly accurate revenue proxies. The SaaS market is exploding—projected to hit $300-408 billion by 2025, with end-user spending growing at 19.1% year-over-year.
To gather this kind of data at scale without getting your IP address blocked, especially if you're tracking multiple competitors, you'll want to look into the best proxies for web scraping.
Ad spend gives you a fantastic foundation, but it's just the first piece of the puzzle. Next, we'll start layering in other data points to make your revenue estimate even sharper.
Using Hiring and Funding to Refine Your Estimate
An ad spend estimate gives you a fantastic starting point, but it's only one piece of the puzzle. If you want to get serious about how to estimate competitor revenue, you need to layer in other public data to sharpen the picture. Relying on a single data point is fragile; the real insight comes from combining multiple signals.
Two of the most powerful signals you can pull are employee count and funding history. These data points provide critical context that ad spend alone can't offer, helping you figure out if a competitor is a bootstrapped profit machine or a cash-burning rocket ship.
The Revenue-per-Employee Benchmark
One of the most reliable benchmarks in the SaaS world is revenue-per-employee. It’s a classic for a reason. You need people to build, market, sell, and support a product, and there’s almost always a strong link between the size of the team and the revenue it generates.
Finding a competitor's employee count is surprisingly easy. A quick search on LinkedIn is usually all it takes. Once you have that number, you can apply an industry-standard benchmark to create another revenue estimate from a completely different angle.
Here are some common benchmarks you can start with:
- Early-Stage / Growing SaaS: These companies typically pull in $150,000 to $250,000 in Annual Recurring Revenue (ARR) per employee.
- Mature / Efficient SaaS: Well-oiled machines can push this number much higher, sometimes hitting $300,000+ per employee.
Let's go back to our fictional competitor, 'ProjectPal'. A LinkedIn search shows they have 30 employees. If we use a conservative benchmark of $200,000 per employee, we get:
30 employees * $200,000/employee = $6,000,000 ARR
That works out to $500,000 in MRR. Now, hold on. Our ad spend calculation pointed to just $50,000 MRR. This is a huge gap, and that discrepancy is exactly why layering data is so important. It tells you there's more to the story and forces you to dig deeper.
Checking Funding Data for Context
The next layer to add is funding. A quick search on a platform like Crunchbase can tell you if a competitor has raised venture capital and how much. This is often the missing piece of the puzzle.
A heavily funded competitor isn't necessarily profitable. They might be aggressively spending investor cash to capture market share, meaning their ad spend and hiring numbers could be inflated relative to their actual revenue.
If we discover ProjectPal has raised a $15 million Series A, their 30-person team suddenly makes a lot more sense. They're likely in a high-growth, cash-burn phase. In that scenario, the lower revenue estimate from ad spend might be closer to the truth, while the employee-based estimate reflects their operational scale, not their current revenue.
On the other hand, if a competitor has zero funding, they're bootstrapped. This means every single dollar they spend on ads and salaries has to come from customers. For a bootstrapped company, a high employee count is a powerful signal of strong, sustainable profitability.
Publicly reported ARR multiples are another great way to cross-reference these findings. With over 30,800 SaaS firms globally, benchmarks are well-established. For instance, if a competitor has 50 employees, industry data from Bessemer Venture Partners' reports suggest revenue estimates could be anywhere from $10-20M ARR. You can find more of these kinds of SaaS statistics from resources like Marketing LTB.
Weaving the Data Points Together
Okay, let's connect the dots. You now have three key data points: ad spend, employee count, and funding status. The goal isn't to find one perfect number, but to build a confident revenue range.
Here’s a simple visual guide to help you interpret the signals:
| Scenario | Ad Spend Signal | Employee Count | Funding Status | My Interpretation |
|---|---|---|---|---|
| The Bootstrapper | High & Consistent | Low to Moderate | None | They're almost certainly profitable. The revenue estimate from ad spend is likely reliable and sustainable. |
| The Growth Rocket | Very High & Rising | High & Growing | Heavily Funded | They're burning cash for growth. Revenue may not cover costs. Ad spend is a better proxy for traction than profitability. |
| The Zombie | Low or Sporadic | Stagnant or Falling | Old/No Funding | They're struggling or just maintaining. Revenue is low, and they're likely not a threat. |
By combining these signals, you move from a simple guess to a strategic assessment. An ad spend of $20k/month from a 10-person bootstrapped company tells a completely different story than the same spend from a 100-person, VC-backed firm. You can explore more on how different SaaS revenue benchmarks can help refine these models. This multi-layered analysis is the core of an effective competitor revenue estimation strategy.
Building Your Competitor Revenue Model
Alright, you've done the legwork and gathered intel on your competitors' ad spend, team size, and funding. Now it's time to connect the dots. A pile of random data points is just noise; an organized model is where you'll find the signal. This is how you turn raw info into a clear map of your competitive landscape and start spotting real opportunities.
The goal here isn't to build some monstrously complex financial model. A simple spreadsheet is all you need. We're creating a reusable framework to document what you found and, more importantly, the assumptions you're making. This gives you a side-by-side view of how different players are really stacking up. To get the most accurate picture, high-quality data enrichment tools can be a huge help in filling in any gaps.
Think of it like this: each data point you add helps you sharpen your focus, moving from a wild guess to a much more confident revenue estimate.
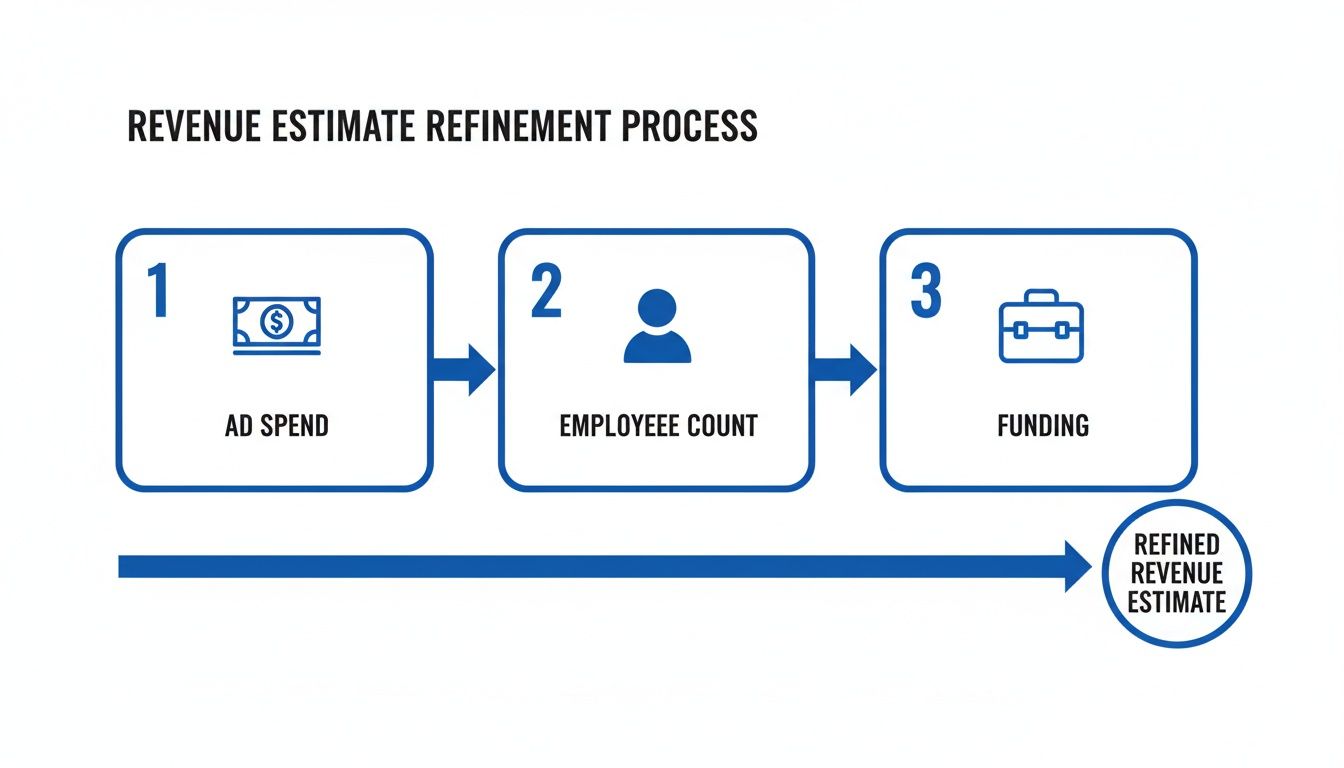
As the diagram shows, you start broad and layer on more signals. Ad spend gives you a baseline, employee count adds another angle, and funding news provides crucial context. Each layer refines your estimate and brings you closer to the truth.
Setting Up Your Estimation Template
Let's get practical and build a template you can use right away. The columns are designed to capture the key metrics we've discussed and produce a final revenue range—because this is an art, not an exact science.
I’ve put together a simple table structure below that you can copy into a spreadsheet. It’s designed to keep your competitor analysis clean, organized, and easy to update.
Competitor Revenue Estimation Template
A simple model to organize public data and calculate a revenue range for your competitors.
| Competitor Name | Monthly Ad Spend ($) | Employee Count | Avg. Price/Month ($) | Est. Monthly Traffic | Calculated Revenue Range ($) |
|---|---|---|---|---|---|
| TaskMaster | 50,000 | 40 | 49 | 200,000 | $125k - $150k |
| FlowState | 15,000 | 8 | 99 | 40,000 | $50k - $60k |
| AgileSprint | 5,000 | 25 | 29 | 15,000 | $8k - $15k |
This template is your new best friend for competitive intelligence. It forces you to document not just the numbers, but the why behind them.
The most important part of this entire exercise is documenting your assumptions. Seriously, don't skip this. It's what keeps your model honest and lets you revisit and tweak your numbers as you learn more. Maybe you assume 40% of revenue goes to marketing, or you use a $200k ARR per employee benchmark. Write it down.
Let’s Walk Through an Example
To see this in action, let's pretend we're analyzing three fictional project management SaaS companies: TaskMaster, FlowState, and AgileSprint.
TaskMaster Analysis:
These guys are spending big on ads and have a pretty large team. The fact that they’re VC-funded explains the aggressive spending. If we assume marketing is 40% of revenue, their $50,000 ad spend suggests a monthly revenue of around $125,000. On the other hand, the employee count method (40 employees * $150k ARR / 12 months) points to a much higher $500,000 MRR. That’s a huge gap. Given the funding, they’re almost certainly over-hired for their current revenue, so we should trust the ad-spend number more.
My Takeaway: When you see a huge gap between ad-based and employee-based estimates for a VC-backed company, it’s a classic sign of a "growth at all costs" playbook. Their actual revenue is much closer to what their marketing spend can justify.
FlowState Analysis:
Now this is interesting. FlowState is bootstrapped with a small, lean team. Their ad spend is modest, but their pricing is higher. The ad spend math ($15k / 0.30) gives us $50,000 MRR. The employee count (8 * $200k / 12) suggests $133,000 MRR. A bootstrapped company has to be profitable, so their real revenue is likely somewhere in the middle. The ad spend gives us a solid floor, and they're probably running a very efficient, profitable business.
AgileSprint Analysis:
Red flags everywhere. They have low ad spend but a surprisingly big team for that budget, and we know they’re heavily funded. The ad spend ($5k / 0.60) points to a tiny $8,300 MRR. A team of 25 costs way more than that to maintain. This company is almost definitely burning through cash while trying to find product-market fit.
From Numbers to Narrative
By laying out the data this way, you’re no longer just looking at isolated figures. You're starting to see the story behind each company. TaskMaster is the aggressive scale-up. FlowState is the lean bootstrapper. AgileSprint is the high-risk, high-burn gamble.
This simple model doesn't just estimate revenue; it reveals their entire business strategy.
This sheet should be a living document. Hear about a new funding round? See a wave of new hires on LinkedIn? Go update your assumptions and see how it changes the picture. You’ve just turned scattered public signals into a strategic map of your market.
Where These Models Can Go Wrong (And How to Keep Them Honest)
Let's be real: estimating competitor revenue this way is an art, not a science. It's incredibly useful, but it's also built on a house of cards—public data and educated guesses. If you aren't careful, it's easy to get a number that looks good but is wildly off base. Knowing where the weak spots are is what separates a sharp analysis from a fantasy report.
The biggest mistake I see people make is grabbing one shiny data point and running with it. Your job isn't to find a single, magic number. That number doesn't exist. Your job is to build a credible range of possibilities.
Don't Fall for the Big Ad Spend Blitz
It’s easy to get spooked when you see a competitor suddenly flood the market with ads. But a massive, short-term ad campaign doesn't automatically mean their revenue is exploding. You have to look deeper.
A sudden, high-budget campaign could mean a few things, and not all of them are good for your competitor:
- They just raised money: They're flush with cash and are spending it to make a splash, often without worrying about immediate ROI.
- They're launching something new: All that noise might be for a single feature launch, not a sustainable growth engine.
- They're just testing: It could be a brief, expensive experiment in a new channel that goes absolutely nowhere.
What you're looking for is consistent ad spend over at least three to six months. A company that reliably spends $30,000 a month is likely in a much healthier spot than one that burns $200,000 in a single month and then disappears.
Remember: Traffic Doesn't Always Equal Customers
Traffic is a vital signal, but it can lie to you, especially in SaaS. If your competitor has a popular freemium plan, their website traffic might be full of people who have zero intention of ever paying. If you model their revenue based on raw traffic, your numbers will be a disaster.
You have to slice your conversion rate assumptions based on their model. For a product with a generous free tier, a realistic visitor-to-paid conversion rate might be a painful 0.5% to 2%. But a competitor who only offers a free trial could realistically see 3% to 5% of their sign-ups convert to paying customers.
Before you even think about connecting traffic to revenue, go study their pricing page. Is it a free trial? A limited free plan? The entire model hinges on understanding how they actually make money.
Staying on the Right Side of the Line
This should go without saying, but let's be crystal clear: what we're doing here is strategic analysis, not corporate espionage. The entire process of how to estimate competitor revenue we've walked through uses one thing and one thing only: publicly available information.
Everything comes from open sources:
- Public Ad Libraries: Information platforms are legally required to share.
- LinkedIn Profiles: Data that people and companies choose to publish.
- Press Releases & News: Public announcements about funding, hiring, or growth.
- SEO & Traffic Tools: Third-party platforms that analyze public web data.
Think of yourself as a detective, piecing together clues that have been left out in the open for anyone to find. You're not hacking into anything or paying for stolen data. As long as you stick to these public sources, your research is perfectly legal, ethical, and a standard part of professional market intelligence. It’s about being smart, not sneaky.
Turning Your Competitor Data Into Action
Alright, you've done the hard work. Your spreadsheet is full of numbers, and you have a solid estimate of what your competitors are pulling in. Now for the most important part: what do you do with this information? This isn't just about crunching numbers for the sake of it; it's about turning that intel into smart, decisive action for your own business.
This whole exercise is designed to strip away the guesswork that kills so many new ventures. Instead of building on a hunch, you're getting an objective look at the market before you sink your own time and money into it. Think of it as building a stronger foundation from the get-go.
Interpreting the Market Signals
The patterns you've unearthed in your competitor's model tell a story about the health of the entire niche. You’re essentially looking for either a green light or a potential red flag.
What you've found should directly shape your next move:
Strong Validation Signal: Did your model reveal multiple competitors consistently dropping serious cash on ads? That's a fantastic sign. It means they're finding customers, making money, and seeing a positive return on that ad spend. This is your green light to move forward with confidence. The market is proven.
A Potential Red Flag: On the flip side, if you see low, sporadic ad spending across the board, pump the brakes. This could mean a few things, none of them great. Maybe the market is tiny, the customers are incredibly difficult to convert, or the lifetime value just isn't high enough to support paid acquisition. It's a clear warning to dig deeper or maybe even rethink your approach.
By learning how to estimate competitor revenue, you're not just spying on others—you're pressure-testing your own idea against real-world market dynamics. It's about building your venture on a solid foundation of data, not just hope.
Ultimately, this process takes you from a place of ambiguity to a much clearer path forward. It gives you the power to build a business with a fundamentally higher chance of success, right from day one.
Got Questions? Let's Talk It Out.
Even with the best models, a few questions always come up when you start digging into competitor revenue. Let's tackle some of the most common ones I hear, so you can move forward with confidence.
How Accurate Are These Revenue Estimates, Really?
Think of these numbers as well-informed approximations, not gospel. The precision of your estimate is only as good as the public data you can find and the assumptions you layer on top.
The point isn't to nail the exact figure down to the dollar. It’s about getting into the right ballpark. Are they a tiny startup or a growing force? Combining signals from ads, hiring, and even funding rounds gives you a far clearer picture than just guessing in the dark.
This method is all about directional accuracy. Is the data pointing to a $50K MRR business or a $500K MRR business? That’s the kind of strategic insight that actually matters.
What If a Competitor Isn’t Running Ads on Meta?
No Meta ads? No problem. The core method doesn't change—you just pivot to different public signals. The goal is always to find visible data and build your model from there.
Look for other clues that tell a story:
- Web Traffic: Fire up an SEO tool like Ahrefs or Semrush to gauge their organic traffic. Apply a conservative conversion rate based on their pricing, and you've got a new starting point.
- Review Volume: Jump on sites like G2 or Capterra. A steady stream of new reviews is a strong indicator of a healthy, growing customer base.
- Job Postings: If a company is hiring a bunch of salespeople or customer success managers, you can bet they're scaling revenue to support those roles.
Is This Kind of Competitor Analysis Even Legal?
Absolutely. We're only using publicly available information here. This is data that companies either share willingly (like on their careers page) or that is made public through transparency regulations (like ad libraries).
You aren't touching private servers, internal documents, or anything confidential. This is just smart, ethical competitive analysis—a fundamental part of building any successful business.
Stop guessing and start building with confidence. Proven SaaS turns public ad data into validated SaaS ideas, showing you which markets are already profitable. Find your next big idea on proven-saas.com.
Build SaaS That's
Already Proven.
14,500+ SaaS with real revenue, ads & tech stacks.
Skip the guesswork. Build what works.
Trusted by 1,800+ founders