Growing a SaaS company without clear benchmarks is like driving in the fog. You need to know what "good" looks like to see if you're heading in the right direction.
For 2025, the vital signs of a healthy SaaS business are straightforward. You're looking for a Lifetime Value to Customer Acquisition Cost (LTV:CAC) ratio above 3:1, a monthly customer churn rate between 3-5%, and a demo-to-close rate of 15-25%. Think of these as the three main dials on your growth dashboard.
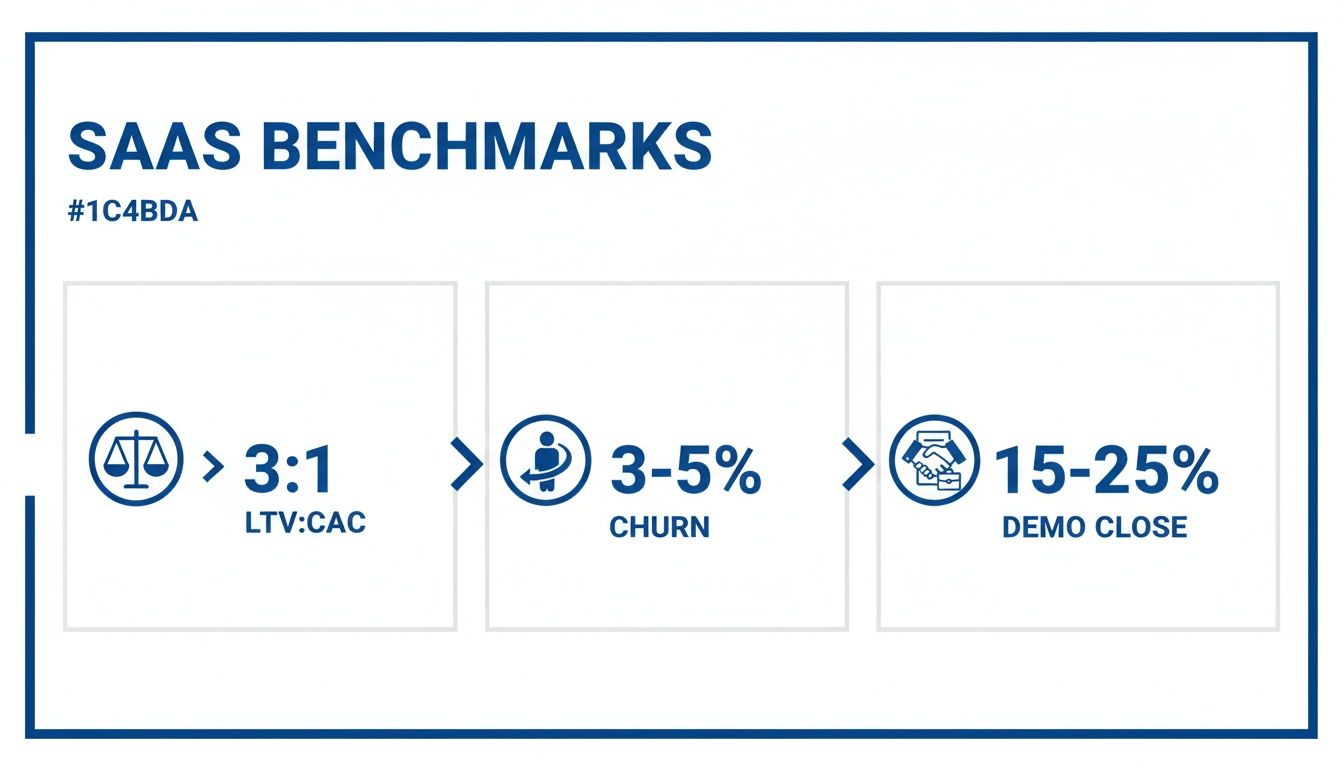
Key SaaS Marketing Benchmarks 2025 at a Glance
This simple table breaks down the most important metrics, showing you what to aim for whether you're just starting out or scaling up.
| Metric | Benchmark (Early-Stage) | Benchmark (Growth-Stage) | What It Really Means |
|---|---|---|---|
| LTV:CAC Ratio | > 3:1 | > 4:1 | Are you making more money from customers than you spend to get them? |
| Monthly Logo Churn | 3-5% | < 3% | How many customers are leaving each month? (Lower is always better.) |
| Demo-to-Close Rate | 15-20% | > 25% | How good is your sales team at turning demos into paying customers? |
| MQL-to-SQL Rate | 10-15% | > 20% | Is marketing sending quality leads that sales can actually work with? |
| CAC Payback Period | < 12 months | < 8 months | How quickly do you earn back the money spent to acquire a customer? |
These benchmarks aren't just numbers on a spreadsheet; they're the direct result of smart marketing, a product people love, and an efficient sales process.
Why Benchmarks Are Your Best Friend for Goal-Setting
When you use real-world data, you stop guessing and start making smart decisions. Benchmarks help you spot performance gaps, set achievable goals, and put your budget where it will have the biggest impact.
Take budgeting, for instance. It's common for SaaS companies to reinvest 40–60% of their revenue back into sales and marketing. A big piece of that—often 30% of the entire annual budget—goes directly to marketing activities.
And where does new growth come from? For larger companies with over $50M ARR, a massive 60% of new revenue now comes from existing customers. This shows how crucial it is to keep current customers happy and find ways to grow those accounts.
By comparing your numbers to these industry standards, you can catch problems early. For example:
- Low LTV:CAC ratio? Your ad spend might be too high or your targeting is off.
- High churn? You might have a product issue or a confusing onboarding process.
This data-driven approach helps you stay agile. Whether you're a founder pitching investors or a marketer running campaigns, these numbers provide the context you need to build a winning strategy.
For a deeper dive into all the metrics that matter, check out the complete Proven SaaS benchmarks report.
How We Source Our SaaS Benchmark Data
Good data comes from a transparent process. Many industry reports rely on surveys, which can be unreliable or outdated. We took a different approach for our SaaS marketing benchmarks 2025 report.
Our benchmarks are built on publicly available data signals, giving you a real-time snapshot of what’s happening in the market.
The core of our analysis is the Meta Ad Library. It’s a massive, constantly updated database of advertising activity. We use AI to analyze thousands of these ads every day. This lets us see which SaaS companies are spending consistently on ads—a strong signal of success—and understand their business by analyzing their websites.
Our Data Modeling Process
We don't just count ads; we look for meaningful patterns. Our system flags SaaS companies that maintain a consistent ad budget because it’s a great indicator of market validation and revenue. Think of it this way: if a company spends over $10,000 per month on ads for several months, they've likely found a profitable way to get customers.
From there, we model the key metrics. We combine ad spend data with website traffic estimates and proven financial models for different SaaS niches. This allows us to generate solid estimates for metrics like Customer Acquisition Cost (CAC) and Monthly Recurring Revenue (MRR) growth, all without survey bias.
Here’s a look inside the Proven SaaS platform, where we analyze these signals to find SaaS companies with real momentum.
This screenshot shows how we identify companies that are investing heavily in ads, which points directly to a validated and profitable business model.
Our approach is built on what companies do, not just what they say. For any founder or marketer, that’s a huge advantage when you need an honest view of the market.
Why This Approach Matters for 2025
Using public data gives you a more dynamic and objective view of the SaaS world. You can see which markets are profitable right now, based on the real-world spending decisions of thousands of companies. This is crucial for spotting trends and setting realistic goals for the year ahead.
Our process is simple:
- Spot Ad Signals: We monitor thousands of SaaS advertisers and focus on those with consistent, significant ad spend.
- AI-Powered Categorization: Our AI scans company websites to classify them by industry, business model, and estimated revenue.
- Model the Metrics: We then apply financial models to estimate performance benchmarks without needing private company data.
This unique, data-first method is what makes the SaaS marketing benchmarks 2025 in this guide so accurate and useful for your growth strategy.
Key Benchmarks For Customer Acquisition And Lifetime Value
The balance between what you spend to get a customer (CAC) and how much they're worth over time (LTV) is the engine of a healthy SaaS business. Get this wrong, and you're just burning cash. Get it right, and you have a clear path to growth.
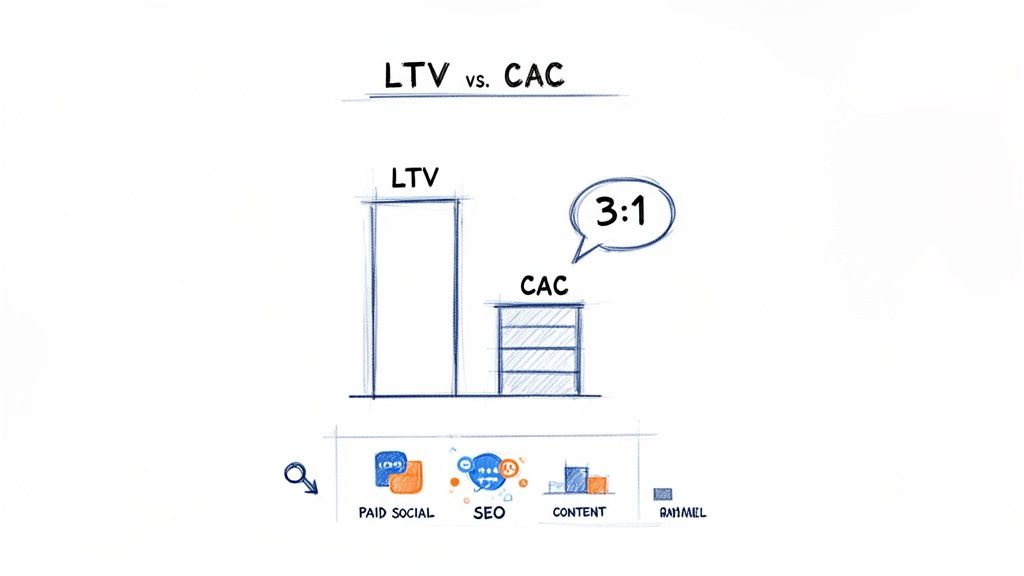
For 2025, the magic number is still a 3:1 LTV to CAC ratio. In simple terms, for every $1 you spend acquiring a customer, you should expect to get at least $3 back over their lifetime.
- Below 3:1? That's a red flag. You might be paying too much for ads or your product isn't keeping customers around.
- Above 5:1? You've built an incredibly efficient growth machine and can likely afford to spend more aggressively to scale faster.
Putting The LTV to CAC Ratio Into Practice
Let's look at a simple example. If your average customer LTV is $10,000, your target CAC should be no more than $3,333 to maintain a healthy 3:1 ratio. This one number gives your marketing team a clear budget to work with for every new customer.
Knowing where you stand is everything. You can explore more detailed LTV:CAC ratio benchmarks to see how your numbers stack up against the competition.
How Different Channels Affect Your Ratio
Not all marketing channels are created equal. Each one has a different cost and attracts a different type of customer, which means each will have a very different LTV:CAC ratio. You can't just look at the average; you need to break it down by channel to know where to invest your budget.
For example, if SEO brings in customers at a 5:1 ratio while paid ads are closer to 2:1, you have a clear signal to double down on what’s working.
2025 LTV to CAC Ratio Benchmarks by Marketing Channel
The table below shows what you can generally expect from common SaaS marketing channels in 2025. Pay close attention to the payback period—how long it takes to earn back your acquisition cost. For a deeper look, check out these CAC payback benchmarks.
| Marketing Channel | Average LTV:CAC Ratio | Typical CAC Payback Period (Months) | 2025 Strategy in a Nutshell |
|---|---|---|---|
| SEO & Content Marketing | 5:1 - 8:1 | 8 - 14 | Great long-term value, but it's a marathon, not a sprint. Requires patience. |
| Paid Social (e.g., Meta) | 2:1 - 4:1 | 4 - 8 | Fast results and precise targeting, but costs are rising. |
| Paid Search (e.g., Google Ads) | 3:1 - 5:1 | 5 - 9 | Captures people actively searching for a solution, which often means better leads. |
| Referral & Word-of-Mouth | > 8:1 | < 3 | Your most profitable customers. This all starts with a great product. |
These SaaS marketing benchmarks for 2025 make it clear why a diversified marketing strategy is so important. A smart mix of channels helps you balance quick wins with sustainable, long-term growth.
MRR Growth And Churn Rates: Your SaaS Heartbeat in 2025
Once you have customers, your survival depends on two things: growing revenue and keeping the customers you already have. Monthly Recurring Revenue (MRR) growth and churn are the two vital signs of your SaaS business. And what's considered "good" for these metrics in 2025 depends on your company's size.
For early-stage startups, rapid MRR growth is the main goal. As you scale, keeping customers and getting them to spend more becomes just as important. Knowing the benchmarks for your Annual Recurring Revenue (ARR) level helps you set goals that make sense.
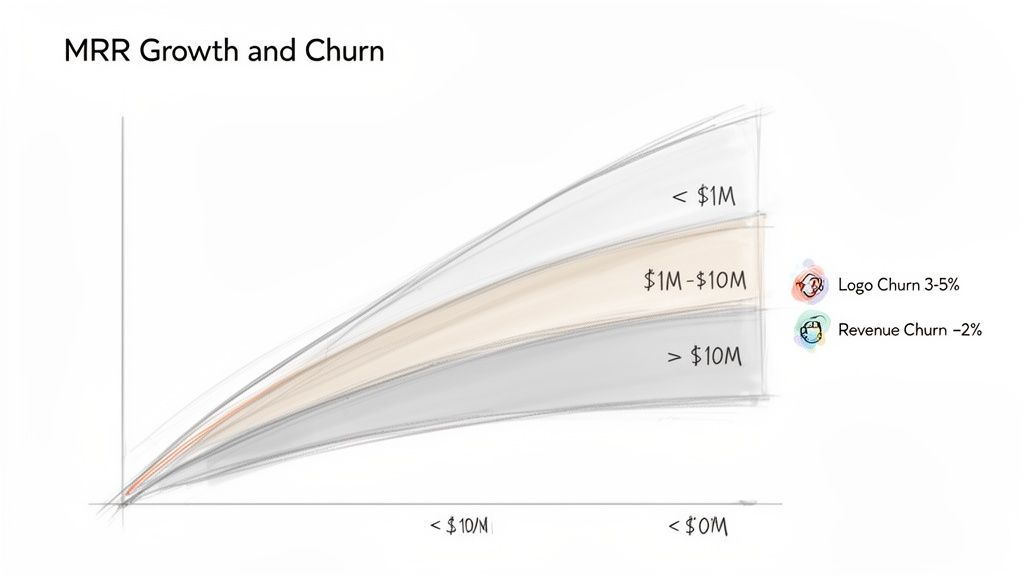
Logo Churn vs. Revenue Churn: What's the Difference?
You need to track two types of churn because they tell you very different stories about your business.
- Logo Churn: This is the percentage of customers (or "logos") who cancel their subscription each month. It’s a simple measure of customer retention.
- Revenue Churn: This tracks the percentage of MRR you lose from customers canceling or downgrading. It shows you the financial impact of churn.
An early-stage SaaS selling to small businesses might be okay with a 3-5% monthly logo churn. But for a company selling to large enterprises, that same number would be a major problem. They should aim for 1% or less. You can see a more detailed breakdown in our MRR growth rate benchmarks.
The Holy Grail: Negative Net Revenue Churn
As your company matures, the goal becomes negative net revenue churn. This is the magic moment when the new revenue you generate from existing customers—through upgrades and add-ons—is more than the revenue you lose from cancellations.
When you hit negative net revenue churn, your business grows automatically, even without signing a single new customer. It's the ultimate sign of a sticky product and a smart expansion strategy.
For example, imagine you lose $5,000 in MRR from customers who left, but you gained $7,000 from existing customers who upgraded. Your net revenue churn is now -2%. This is exactly what investors love to see.
The SaaS marketing benchmarks for 2025 are clear: fast growth gets you started, but mastering retention is what builds a company that lasts.
Your Funnel Conversion Rates: The SaaS Health Check
Think of your marketing funnel as a pipeline. Every crack is a leak where you lose potential revenue. Knowing the standard conversion rates for each stage helps you find and fix those leaks. These 2025 SaaS marketing benchmarks show what a healthy funnel looks like, from the first website visit to the final sale.
When you know the numbers, you can stop guessing.
- Low visitor-to-lead rate? Your homepage messaging might be off.
- Poor trial-to-paid conversion? Your product onboarding probably needs work.
Let's break it down stage by stage.
From Anonymous Visitor To Qualified Lead
The top of the funnel is about getting a stranger to show interest. The benchmarks here depend on your business model—whether you're product-led (PLG) and pushing for free trials, or sales-led and driving demo requests.
Here’s what to aim for:
- Website Visitor-to-Trial Signup (PLG): A good rate is between 2-5%. If you're below 2%, look at your homepage copy and calls-to-action.
- Website Visitor-to-Demo Request (Sales-Led): This is a bigger ask, so the numbers are lower. Aim for 1-3%.
- Lead-to-Marketing Qualified Lead (MQL): You should be qualifying about 10-15% of all your leads as MQLs. This shows your content is attracting the right audience.
For perspective, if your landing page gets 10,000 visitors, a 3% trial signup rate gives you 300 new users. Simple math, but crucial for setting realistic goals.
From MQL To Closed-Won Customer
Once you have a qualified lead, the real work begins. The bottom of your funnel is where you measure how well your sales team (or your product) turns interest into revenue.
For a sales-led company, the demo is the most important step. If your demo-to-close rate is low, it often means there's a disconnect between what marketing promises and what sales delivers. Fixing that one metric can dramatically lower your Customer Acquisition Cost.
Here are the key benchmarks for the final stages:
- Trial-to-Paid Conversion (PLG): For a freemium model, a 2-5% conversion rate is standard. If you require a credit card for a free trial, expect a much higher rate of 40-50%.
- MQL-to-Sales Qualified Lead (SQL): This is the crucial handoff from marketing to sales. A healthy rate of 20-30% shows both teams are aligned on what a "good lead" is.
- Demo Request-to-Close Rate (Sales-Led): This is the ultimate measure of sales effectiveness. The industry standard is 15-25%. If your team is closing above 25% of their qualified demos, they are doing an excellent job.
By regularly comparing your funnel metrics to these 2025 benchmarks, you can quickly find weak spots and focus your efforts where they'll make the biggest difference.
What's Next? SaaS Marketing Trends and Takeaways for 2025
Knowing your benchmarks is like having a map of where you are today. But understanding trends is about seeing where the road is headed. For 2025, a few clear patterns will define how the smartest SaaS companies market their products.
The global SaaS market is booming, valued somewhere between $232 billion and $390 billion. For marketers, that growth means intense competition. This is why SEO and content marketing are more important than ever, with SEO driving 30–60% of the sales pipeline for many companies. The data is clear: good content generates three times more Marketing Qualified Leads (MQLs) than traditional outbound sales calls.
So, what should you do with this information?
SEO and Content Are Still the Foundation
Ad costs are rising, but the 2025 data confirms what we've known for years: organic growth is a core business asset. Companies that invest in a solid content and SEO foundation will consistently generate high-quality leads more efficiently in the long run. This doesn't mean ditching paid ads. A smart strategy uses paid advertising to boost top-performing content or target specific audiences. But the trend is clear: organic visibility drives sustainable growth.
The Big Return of In-Person Connection
After years of virtual meetings, in-person events are making a powerful comeback. For SaaS companies, face-to-face interactions are once again becoming a top driver of new revenue.
While digital channels give you scale, in-person events build trust and connection in a way that’s hard to replicate online. In a crowded market, they are a key differentiator.
AI and Automation Are No Longer Optional
AI in marketing is no longer a futuristic idea; it's a standard tool. From personalizing customer journeys to predicting churn, AI-powered platforms are essential for efficiency. To stay competitive and hit your 2025 benchmarks, you need to embrace this technology. Explore the best SaaS marketing automation tools for growth in 2026 to see what's on the horizon. Adopting these tools isn't just about saving time—it’s about using data to make smarter, faster decisions.
Got Questions About SaaS Benchmarks? We've Got Answers.
We get it—digging into SaaS metrics can feel complicated. To help, here are simple answers to the most common questions about SaaS marketing benchmarks for 2025.
What’s a Good LTV:CAC Ratio for SaaS in 2025?
The magic number is 3:1. For every $1 you spend to get a new customer, you should make at least $3 back over their lifetime.
If your ratio is below 3:1, your acquisition strategy might not be sustainable. If it's 4:1 or 5:1, you have a highly efficient growth engine and can confidently invest more in marketing and sales.
How Much Should an Early-Stage SaaS Spend on Marketing?
Early on, growth is the top priority. It's common for new SaaS companies to reinvest 40% to 60% of their revenue back into sales and marketing to capture market share quickly.
A good starting point is to dedicate about 30% of your total annual budget specifically to marketing. But remember, it's not just about spending; it's about spending smart. Keep a close eye on your CAC and LTV to ensure your investment fuels sustainable growth.
It's less about the exact percentage and more about the return. An aggressive marketing spend is only a good investment if your unit economics are solid.
What's an Acceptable Monthly Churn Rate for a B2B SaaS?
The "right" churn rate depends on who you sell to. If your customers are small-to-medium businesses (SMBs), a monthly logo churn rate of 3% to 5% is generally acceptable.
If you target mid-market or enterprise clients, you need to aim much lower—ideally, below 2%. The ultimate goal is negative net revenue churn. This happens when the new revenue from your existing customers (through upgrades) is greater than the revenue you lose from cancellations. It’s the clearest sign of a healthy, growing business.
Ready to stop guessing and start building on proven ideas? Proven SaaS gives you an unfair advantage by surfacing SaaS companies with real traction, backed by public ad-spend data. Find your next profitable niche today.
Build SaaS That's
Already Proven.
14,500+ SaaS with real revenue, ads & tech stacks.
Skip the guesswork. Build what works.
Trusted by 1,800+ founders