Let's get right to it. In 2025, if you don't have a firm grip on your Customer Acquisition Cost (CAC), you're not just leaving money on the table—you're risking your entire business. With marketing costs on the rise, efficiency is the name of the game. This guide will give you clear benchmarks and simple strategies to make sure every dollar you spend on growth counts.
Your Guide to 2025 SaaS CAC Benchmarks
Think of your Customer Acquisition Cost as the exact price tag for winning one new customer. It’s a critical number that influences your runway, your path to profitability, and your ability to scale. Flying blind on CAC means you’re just guessing with your marketing budget.
The pressure is on for 2025. For many B2B SaaS companies, the challenge is real. We're seeing average customer acquisition costs climb to $1,200 per customer, driven by longer sales cycles. This has created a massive efficiency gap. The best companies are spending just $1.00 to bring in $1 of new Annual Recurring Revenue (ARR). In contrast, the bottom 25% are burning through $2.82 for that same dollar of revenue. You can dig into more of these CAC trends for growth companies to see what separates the leaders from the pack.
Here's a quick look at what to expect in 2025. These numbers provide a solid starting point for evaluating your own performance.
2025 SaaS CAC Quick Look By ARR Stage and Channel
| Category | Metric | 2025 Benchmark Range |
|---|---|---|
| By ARR Stage | <$1M ARR | $300 - $800 |
| By ARR Stage | $1M - $10M ARR | $700 - $1,500 |
| By ARR Stage | >$10M ARR | $1,200 - $2,500+ |
| By Channel | SEO/Content | $150 - $450 |
| By Channel | Paid Social | $400 - $900 |
| By Channel | Paid Search | $600 - $1,200 |
| By Channel | Outbound Sales | $1,000 - $3,000+ |
Of course, these are just benchmarks. Your specific industry, product complexity, and sales model will cause these numbers to vary.
Why These Benchmarks Matter
So, why obsess over these numbers? Because they act as a compass for your business. Knowing where you stand helps you:
- Set Realistic Goals: Give your teams targets that are ambitious but achievable.
- Spot Red Flags: If your CAC is way higher than the benchmark, it’s a clear signal something is broken and needs fixing—fast.
- Spend Smarter: Understand which channels are most effective to put your cash where it will actually drive growth.
- Talk to Investors: Show investors that your CAC is healthy, proving you're building a sustainable, scalable company.
Key Takeaway: CAC isn't just a line item. It’s a core indicator of your company's health. In a world of rising costs, efficient customer acquisition is your biggest competitive advantage.
This guide will give you the detailed saas cac benchmarks 2025 you need, broken down by company stage, channel, and industry. Then, we’ll get practical and show you exactly how to calculate your own CAC and use proven strategies to bring it down.
Calculating Your Customer Acquisition Cost
Before you can compare yourself to the SaaS CAC benchmarks 2025, you need to know your own numbers. Figuring out your Customer Acquisition Cost (CAC) isn't complex; it's simple, honest math that shows exactly what it costs to land a new customer.
The formula itself is straightforward but powerful. It cuts through the noise to give you one clean metric for your growth engine's efficiency.
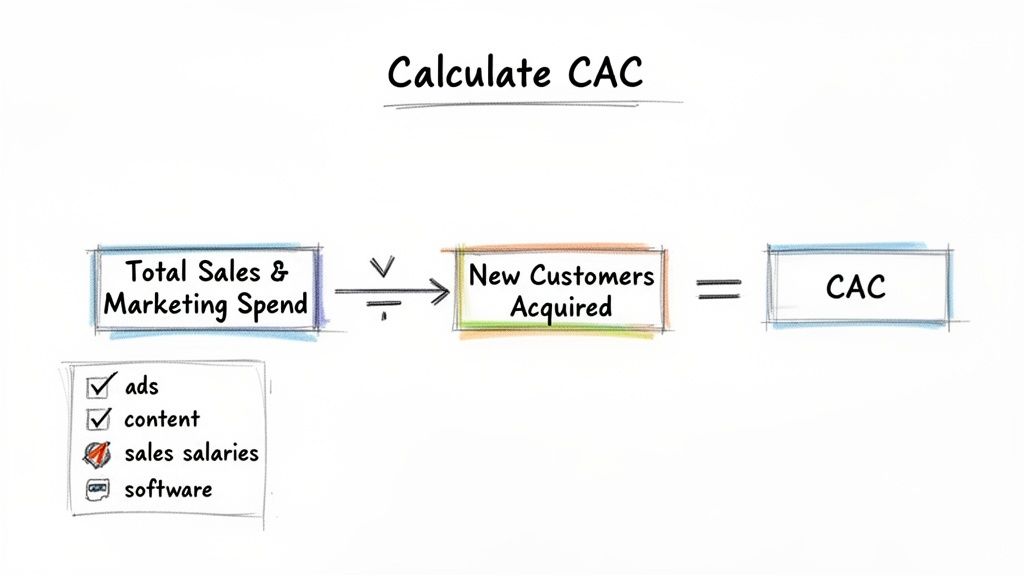
This is your starting point. The key is knowing exactly what to include in "Total Sales & Marketing Spend."
What to Include in Your Total Spend
To get a true picture of your CAC, you need to track every single dollar spent to acquire customers over a set period—like a month or a quarter.
- Advertising Spend: All the cash you're putting into Google Ads, Meta, LinkedIn, and any other paid channels.
- Content Creation Costs: Freelancer fees, video production, or webinar expenses.
- Team Salaries: Salaries for your marketing and sales staff focused on acquisition.
- Commissions and Bonuses: Payments to your sales team for closing new business.
- Software and Tools: Subscriptions for your CRM, marketing automation, analytics platforms, etc.
As you tally these costs, it helps to be clear on the ad models you're using. If you need a refresher, it's worth understanding the difference between CPC, CPM, and CPA.
A Simple CAC Calculation Example
Let's make this real. Imagine a startup, "SyncUp SaaS," calculates its CAC for Q1.
Here’s a breakdown of their spending:
- Total ad spend: $15,000
- Content marketing (freelancers, tools): $3,000
- Salaries for sales & marketing: $30,000
- Software subscriptions (CRM, etc.): $2,000
Their total sales and marketing spend is $50,000. In that same quarter, they acquired 100 new customers.
The math is simple: $50,000 / 100 customers = $500 CAC.
Just like that, SyncUp knows it costs them an average of $500 to bring a new customer through the door.
Blended CAC vs. Paid CAC
Here's a crucial distinction: tracking both "Blended" and "Paid" CAC. This is a game-changer for making smart budget decisions.
Blended CAC includes all new customers, whether they came from a paid ad, a blog post, or word-of-mouth. It's your company-wide average.
Paid CAC is surgical. It only looks at customers you acquired directly through paid channels. This tells you how effective your ad dollars really are.
Why track both? Because it reveals the true ROI of your marketing spend. If your Blended CAC looks great but your Paid CAC is sky-high, it’s a red flag. It probably means your free, organic channels are masking an inefficient paid strategy. With that insight, you can start optimizing your campaigns for real impact.
If you're looking to play out different scenarios with these numbers, our SaaS revenue calculator is a great tool for forecasting.
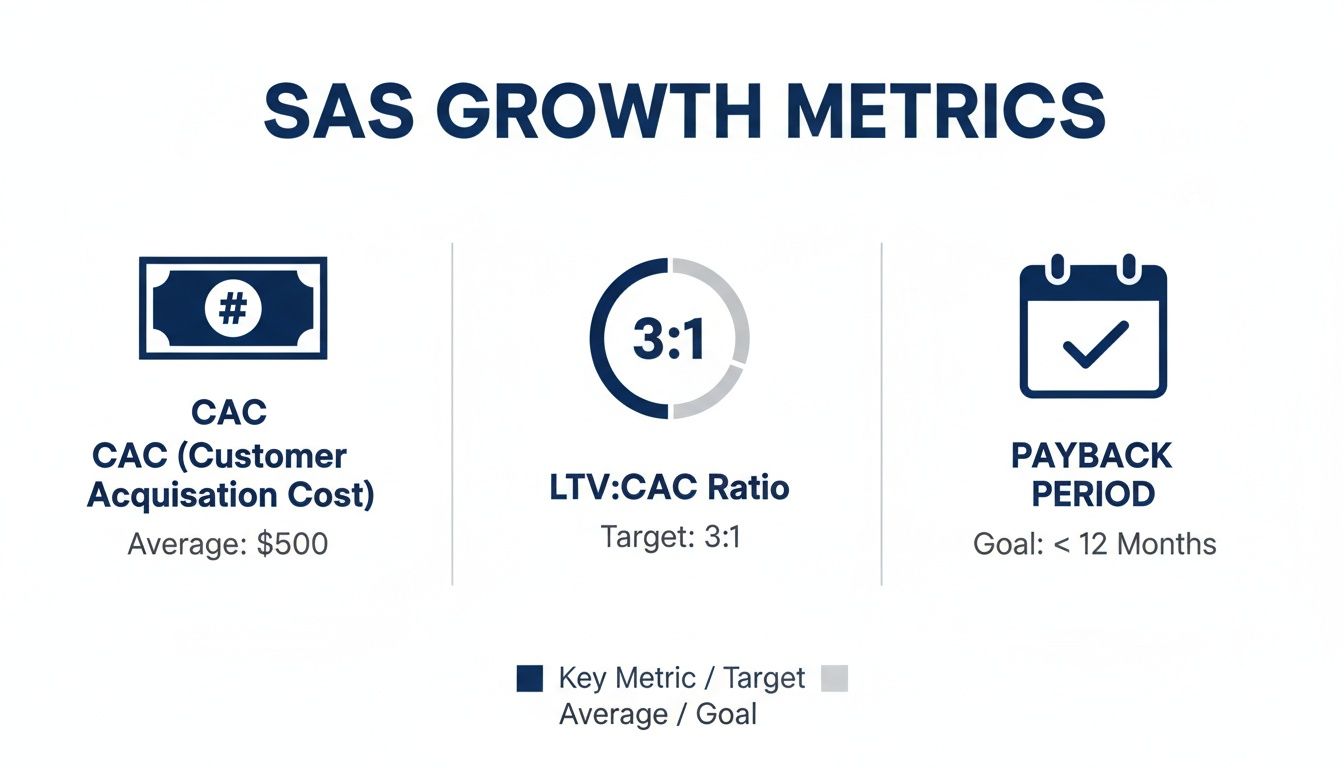
Looking Beyond CAC: What LTV and Payback Period Truly Tell You
Knowing your Customer Acquisition Cost is a solid start, but it’s only one piece of the puzzle. A $500 CAC might be a great deal or a total disaster—you can't tell without knowing what that customer is worth over time. To see if CAC is a smart investment, you need its two partners: Customer Lifetime Value (LTV) and the CAC Payback Period.
These two metrics give you the full story. They help you answer the toughest questions: Are we building a sustainable business, or are we just burning cash?
The LTV to CAC Ratio: Your Growth Machine's ROI
Think of the LTV:CAC ratio as the final grade on your growth strategy. It answers one powerful question: for every dollar we spend to get a customer, how many dollars do we get back over their lifetime?
Imagine your business is a machine. If you put $1 in and only get $1 back, you’ve built a treadmill. But if you put $1 in and get $3, $4, or $5 back? Now you’ve built a machine that prints money.
For 2025, the magic number for a healthy SaaS business is a 3:1 LTV to CAC ratio. This means for every dollar spent on acquisition, you should make at least three dollars back. It's the sign of a scalable, efficient growth model. If your ratio dips below 3:1, it's a red flag. Top-tier companies, meanwhile, are hitting 4:1 or even 5:1, giving them the confidence to invest more in growth.
The 3:1 Rule: A healthy SaaS business should have an LTV that's at least three times its CAC. A 3:1 ratio is the benchmark for a solid business model.
Understanding Your CAC Payback Period: Cash is King
While LTV:CAC is about long-term profitability, the CAC Payback Period is all about short-term survival. Cash flow is everything. This metric tells you exactly how many months it takes for a new customer to generate enough revenue to cover their acquisition cost.
Think of it as the break-even point for each customer. A long payback period puts a huge strain on your finances, as you front the cash for growth and wait for customers to become profitable.
So, what does a good payback period look like?
- Ideal: Less than 12 months. This is the gold standard for venture-backed SaaS companies that need to grow fast and efficiently.
- Acceptable: 12-18 months. This can work for enterprise businesses with large contracts and high LTV.
- Risky: More than 18 months. A payback period this long can cause serious cash flow problems and may signal issues with pricing or churn.
For a more detailed breakdown, check out our complete guide on CAC Payback Benchmarks for SaaS companies.
By watching your LTV:CAC ratio and payback period, you get a 360-degree view of your acquisition health. One tells you if you're building long-term value, and the other makes sure you have enough cash to get there.
SaaS CAC Benchmarks by Channel and Industry
Not all customer acquisition channels are created equal. The same goes for SaaS industries. A dollar spent on paid search for a FinTech product will get a different result than a dollar spent on content marketing for a developer tool. To make smart decisions, you must look beyond a blended, company-wide CAC and slice the data by channel and industry.
This is where high-level numbers become truly useful insights. Getting a handle on these specific SaaS CAC benchmarks for 2025 helps you allocate your budget effectively and set meaningful targets.
Breaking Down CAC by Acquisition Channel
Your choice of marketing channels directly shapes your average CAC. Channels that promise fast results, like paid ads, almost always come with a higher price tag. Organic channels take more time but can become incredibly efficient growth engines.
This simple visual shows the key SaaS growth metrics you should track as you analyze how each channel performs.
As you can see, CAC, LTV:CAC ratio, and payback period are all tied together. You can't just look at one without considering the others, especially when figuring out if a channel is profitable.
When digging into channel-specific CAC, it’s also critical to understand each platform. For example, knowing how to properly advertise on TikTok can be the difference between burning cash and efficiently acquiring new customers.
Key Insight: Don't just chase the channel with the lowest CAC. The best channels are the ones that deliver customers with a great LTV:CAC ratio. A $1,000 CAC that lands you a customer with a $5,000 lifetime value is a far better investment than a $200 CAC for a customer worth only $400.
Examining CAC Across SaaS Verticals
Just as channels have different cost profiles, so do industries. A MarTech company fights for clicks in a crowded market, leading to a higher CAC. Compare that to a niche Dev Tool company with a well-defined audience, and you'll see a different picture. The dynamics of each vertical—market size, competition, and customer value—create unique benchmarks.
For example, FinTech and Healthcare SaaS companies often face higher CACs due to strict regulations and the need to build trust. On the other hand, verticals like project management tools can achieve a lower CAC by using freemium models and word-of-mouth growth loops.
This table breaks down what you can expect across various channels and verticals in 2025. Use it to see how your performance stacks up against your peers.
2025 SaaS CAC Benchmarks by Acquisition Channel and Industry Vertical
This table provides a detailed breakdown of estimated Customer Acquisition Costs across popular marketing channels and key SaaS industry verticals to help founders benchmark their performance.
| Channel / Vertical | Average CAC ($) | Typical Payback Period (Months) | Key Considerations for 2025 |
|---|---|---|---|
| Paid Search | $600 - $1,200 | 8 - 14 | Rising keyword competition and the need for sophisticated campaign management are driving costs up. |
| Paid Social | $400 - $900 | 6 - 12 | Requires strong creative and precise audience targeting to cut through the noise. |
| SEO / Content | $150 - $450 | 12 - 24+ | A long-term investment that requires patience but yields the most profitable customers over time. |
| Outbound Sales | $1,000 - $3,000+ | 12 - 18 | Best for high ACV (Annual Contract Value) deals where a personal touch is necessary to close. |
| FinTech | $700 - $1,500 | 10 - 16 | High LTV justifies the cost, but trust and security are paramount, lengthening sales cycles. |
| MarTech | $600 - $1,300 | 9 - 15 | An extremely crowded space where brand differentiation is critical to keeping acquisition costs in check. |
| Dev Tools | $300 - $800 | 6 - 10 | Often benefits from PLG motions and strong community-led growth, leading to a more efficient CAC. |
| HR Tech | $500 - $1,100 | 8 - 14 | Can be a competitive market, but clear ROI for businesses helps justify the acquisition spend. |
These numbers tell a clear story. The more competitive the space (like MarTech) and the larger the average deal size (like with enterprise sales), the more you should expect to pay for each new customer. The trick is making sure your LTV and payback period make that investment worthwhile.
Practical Ways to Lower Your SaaS CAC
Knowing the benchmarks is one thing, but improving your own numbers is where the real work begins. High acquisition costs can silently eat away at your runway. But with the right approach, you can get them under control.
Here are three simple, practical strategies you can use to lower your CAC and build a more efficient growth machine.
The goal isn’t just to spend less money—it’s to spend it smarter. We'll focus on the areas that deliver the biggest impact.
1. Fine-Tune Your Conversion Funnel
Think of your landing page as the front door to your business. Any friction—a confusing layout, slow loading time, or a weak call-to-action—costs you money. It sends people away and your ad dollars down the drain.
Improving your conversion rate is one of the fastest ways to slash your CAC, because you're getting more customers from the traffic you're already paying for.
Here’s a simple example. Let's say you spend $10,000 a month on ads that send 1,000 people to your site.
- If your landing page converts at 2%, you get 20 new customers. That’s a $500 CAC.
- Now, imagine you improve the page and bump that conversion rate to 3%. With the same ad spend, you now get 30 new customers. Your CAC drops to $333.
Actionable Tip:
- A/B test your main headline. Pit your current headline against one focused on a clear, powerful customer benefit. This one small change can often deliver a big lift.
2. Build an SEO and Content Engine
Paid ads get you results now, but it's like renting an audience. The second you stop paying, the traffic stops. SEO and content marketing are like buying an asset. It’s a long-term play, but it creates a sustainable, low-cost way to get customers for years to come.
By creating helpful content that solves your ideal customer's problems, you naturally attract qualified leads. This builds a powerful flywheel where your acquisition costs decrease over time as your content library grows and ranks.
Good content also makes your paid ads work better by educating prospects and building trust before they even see an ad.
Actionable Tip:
- Find three "long-tail" keywords your customers search for. These are specific phrases like, "best project management tool for small remote teams." They have less competition and signal high buying intent. Write one genuinely useful blog post for each keyword.
3. Launch a Customer Referral Program
Your happiest customers are your best (and cheapest) salespeople. A recommendation from them is more powerful than any ad. A smart referral program turns that goodwill into a predictable stream of high-quality leads.
A great program makes it easy for customers to share your product and rewards both the person sharing and the person signing up.
Actionable Tip:
- Set up a simple "give $50, get $50" offer. Give current customers a unique link to share. When a friend signs up, both of them get a credit. This two-sided incentive makes people much more likely to participate.
By working on these three areas—your funnel, your content, and your customer base—you can take control of your CAC. This isn't just about hitting the latest saas cac benchmarks 2025; it's about building a healthier, more profitable business.
Finding Profitable Niches with Ad Intelligence
Most SaaS CAC benchmarks give you a look in the rearview mirror—they show you where the market has been. But what if you could peek into the future and de-risk your strategy before you build? This is where ad intelligence changes the game. It lets you "benchmark before you build."
Instead of guessing on a new niche, you can find hard evidence that it's worth pursuing. The idea is simple: if a competitor consistently pours money into ads, that's a massive signal of a healthy, profitable market. They wouldn't keep spending thousands of dollars every month if their LTV:CAC ratio wasn't working.
Sustained ad spend is your proxy for profitability. It’s a clear sign that a company has cracked its acquisition model and is successfully turning ad dollars into revenue. This is market validation at its finest.
Spotting Profitable Opportunities
By tracking what competitors are spending on ads, you can uncover underserved niches or discover messaging that is clearly working. This data-first approach stops you from wasting money in a crowded market with sky-high CAC. Instead, you can find validated pockets of opportunity where others are already winning.
For instance, this dashboard view gives you an instant look at a company's estimated ad spend right next to their revenue signals.
This simple visual tells you immediately if a company's growth is fueled by a serious investment in ads. It confirms a profitable acquisition funnel exists. You can use that insight to prioritize your own ideas based on proven demand.
Using Ad Spend as a Competitive Benchmark
Once you’ve zeroed in on a promising niche, you can dig deeper. Analyzing competitors’ ad creative, their messaging, and the platforms they're using gives you an incredible head start. It’s like getting a cheat sheet for what works.
This process helps you set a realistic baseline for your own SaaS CAC benchmarks 2025 before you even spend a dime. You get to learn from their wins and mistakes.
Key Takeaway: Consistent ad spend is one of the strongest indicators of a profitable SaaS niche. If a competitor can afford to spend $10k+ per month on ads, they have almost certainly figured out a sustainable customer acquisition model.
When you use these insights, you stop relying on theory and start making decisions with real market intelligence. You can build and launch with confidence, knowing you’re entering a market where customers exist and can be acquired profitably.
To see this in action, check out how you can dissect competitor campaigns with our Ad Library. This proactive approach is what separates the startups that take off from the ones that run out of runway.
SaaS CAC: Your Questions Answered
When digging into customer acquisition, many questions come up. Let's tackle some of the most common ones SaaS founders ask.
What’s a Good CAC Payback Period for a SaaS Company in 2025?
The gold standard for a healthy CAC payback period is under 12 months. Hitting this mark means you're getting your money back within a year, freeing up cash to reinvest in growth.
If you’re in the 5-7 month range, you’re in elite company—that’s a sign of a highly efficient growth engine. On the flip side, if your payback period stretches past 18 months, it’s time to pay close attention, as this can strain your cash flow.
How Often Should I Be Looking at My CAC?
You should look at CAC on two different timelines. For day-to-day operations, calculate CAC on a monthly basis. This rhythm lets you see what’s working and tweak campaigns before you burn through your budget.
For the bigger picture, a quarterly review of your CAC and LTV:CAC ratio is perfect. This gives you enough data to make smart decisions about your annual budget and overall growth strategy.
Is CAC Really That Different for B2B vs. B2C SaaS?
Yes, the difference is huge. B2B SaaS companies almost always have a much higher CAC. Sales cycles are longer, more people are involved in the decision, and there are often demos and contracts to manage.
B2C SaaS, on the other hand, usually has a much lower CAC per customer. These businesses are built for volume, relying on freemium models, viral sharing, and social media ads to acquire many users quickly and cheaply.
How Do I Benchmark My CAC if I'm in a Totally New Niche?
This is a great question. When you're first in a new space, there are no direct competitors. It can feel like you're flying blind, but you're not. The trick is to stop looking for industry benchmarks and start looking at channel benchmarks.
Figure out which channels you'll use—like paid search or content marketing—and then find what companies in similar fields are paying on those channels. Look for businesses that target the same kind of customer, even if their product is completely different. This gives you a much more realistic starting point.
For instance, if you see that other companies targeting software developers spend around $400 per acquisition through content marketing, you have a solid, data-backed number to aim for. It's much better than pulling a number out of thin air.
Ready to stop guessing and start building with confidence? Proven SaaS uses ad intelligence to help you discover validated SaaS ideas where competitors are already spending profitably. Find your next profitable niche today.
Build SaaS That's
Already Proven.
14,500+ SaaS with real revenue, ads & tech stacks.
Skip the guesswork. Build what works.
Trusted by 1,800+ founders