When you're trying to figure out what's working in your business, ROAS vs ROI often comes up. The biggest difference is scope. Think of ROAS (Return on Ad Spend) as a magnifying glass looking at the gross revenue from one specific ad campaign. In contrast, ROI (Return on Investment) is the wide-angle lens, measuring the net profit from an entire business effort after you've factored in all the costs.
ROAS is your tactical thermometer checking an ad's temperature, while ROI is your strategic compass pointing toward true business profitability.
Understanding The Core Difference
For SaaS founders, getting this distinction right isn't just theory—it’s crucial for survival. One metric tells you if your ads are catching eyeballs and generating sales, but the other is the only one that tells you if you're actually making money.
It’s easy to get fooled by a high ROAS. Seeing a 4:1 or 5:1 ROAS feels great, but it can create a dangerous illusion of success if your overall ROI is in the red. This happens when you forget about all the other costs of doing business, like salaries, software subscriptions, and operational overhead.
This is why the difference matters so much for your financial decisions. If you only chase a high ROAS, you might end up scaling campaigns that are actually unprofitable, burning through cash while celebrating revenue figures that don't tell the whole story. On the other hand, a clear understanding of ROI ensures every dollar you invest—whether in ads, people, or tools—is actually pushing your business toward real, sustainable growth.
A healthy ROAS proves your marketing message is working. A positive ROI proves your business model is working. You need both, but they answer completely different questions.
To make this crystal clear, let's put the two side-by-side.
Key Differences: ROAS vs ROI at a Glance
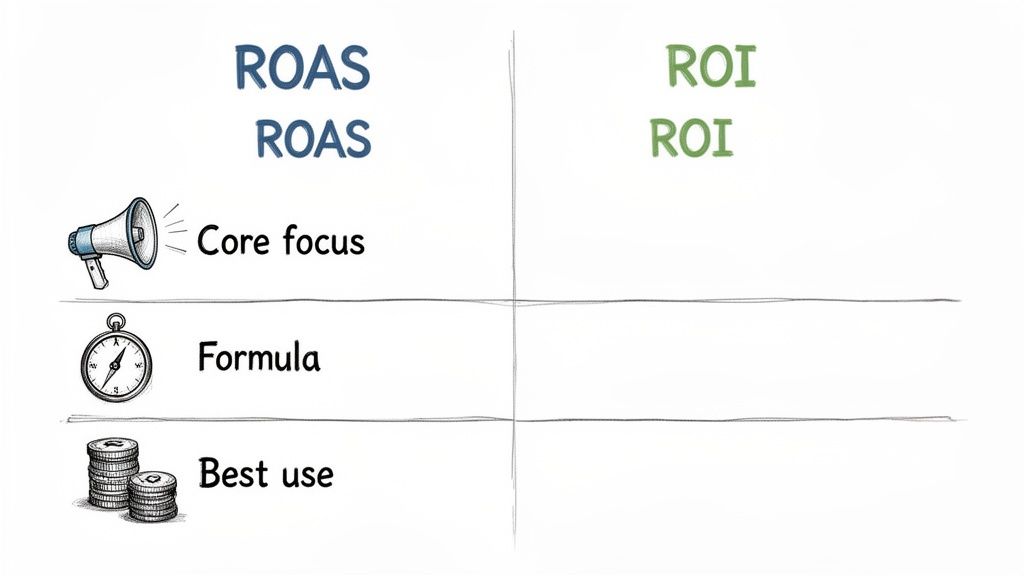
Here’s a simple chart to break down the essentials of Return on Ad Spend (ROAS) and Return on Investment (ROI). It lays out their core focus, what they measure, and when you should use them.
| Metric | Core Focus | Formula | Best Use Case |
|---|---|---|---|
| ROAS | Ad Campaign Efficiency | Revenue from Ads / Cost of Ads | Fine-tuning the performance of specific ad campaigns. |
| ROI | Overall Business Profitability | (Net Profit / Total Investment) x 100 | Assessing the profitability of a complete business initiative. |
This at-a-glance view helps you see exactly where each metric fits into your strategy.
Ultimately, you don't choose one over the other; you use them together to get a complete picture of your company's financial health. ROAS gives your marketing team the immediate feedback they need to tweak campaigns and move budget around effectively.
At the same time, ROI gives leadership the high-level view needed to make smart, strategic decisions for the long haul. Mastering both is non-negotiable for navigating the crowded SaaS world and making sure every marketing dollar is truly an investment in your company's future.
Calculating ROAS: Your Ad Campaign's Thermometer
Think of Return on Ad Spend (ROAS) as a real-time thermometer for your advertising. It’s a direct, tactical metric that tells you one simple thing: for every dollar you spend on an ad campaign, how many dollars in revenue did you get back? This immediate feedback is what makes it so vital for any marketing team.
Its job is to measure the gross revenue generated from a specific advertising effort. Unlike broader profitability metrics, ROAS isolates the performance of your ads, giving you a clear, uncluttered picture of what’s working and what isn’t, right now.
The Simple ROAS Formula
Calculating ROAS is refreshingly straightforward, which is a big part of its appeal. The formula intentionally strips away all other business costs to focus purely on ad efficiency.
ROAS = Total Revenue from Ads / Total Cost of Ads
This simplicity empowers marketers to make quick, data-driven decisions. You can use it to A/B test ad creatives, compare performance across platforms like Google Ads versus Meta, and shift your budget to the channels delivering the best results.
A SaaS Example in Action
Let's look at a simple example. Imagine your SaaS company sells a project management tool.
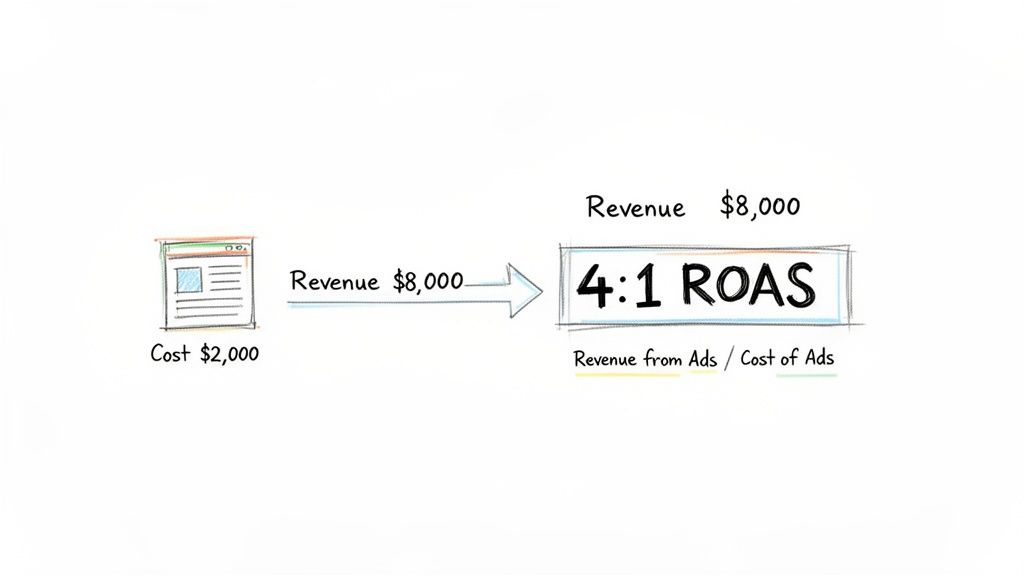
- Ad Spend: You spend $2,000 on a Google Ads campaign.
- New Customers: The campaign brings in 40 new sign-ups.
- Revenue: Each new customer buys a $200 annual plan.
- Total Revenue from Ads: 40 customers × $200/customer = $8,000.
Now, we just plug these numbers into the formula:
- ROAS = $8,000 (Revenue) / $2,000 (Ad Cost) = 4
This is usually shown as a 4:1 ratio or as 400%. It means for every $1 you invested in Google Ads, you generated $4 in immediate revenue. This kind of specific insight is crucial for optimizing campaigns on the fly. To get an edge, you can dive deeper into the creative strategies your competitors are using by exploring a comprehensive ad library.
What Is a Good ROAS?
So, is a 4:1 ROAS good? For most businesses, that’s a solid yes. While the ideal number can vary wildly based on your profit margins, industry, and operating costs, a 4:1 ratio is a common benchmark for strong performance. It suggests your ad spend isn't just paying for itself but is also generating a healthy amount of gross revenue.
But remember, benchmarks can be misleading without context. A 2:1 ROAS might be fantastic for a high-margin software product, while a 10:1 ROAS could be unprofitable for a low-margin e-commerce business saddled with high operational costs.
Looking at industry data gives you a wider perspective. Historically, healthy ROAS figures often land between 3:1 and 5:1. Some channels, like Google Search Ads, can have even higher averages.
Ultimately, ROAS is your tactical guide. It gives you the immediate data you need to refine your ad strategy, ensuring every dollar is working as hard as possible to bring in customers. But as we'll see, it's only one piece of the profitability puzzle.
Calculating ROI: The True North of Business Profitability
If ROAS is the tactical thermometer for your ads, think of Return on Investment (ROI) as your strategic compass. It gives you the big-picture view, answering the one question every founder needs to know: "Is this whole thing actually profitable?"
ROI looks past just ad spend and the revenue it generates. It measures your net profit against the total cost of your investment, factoring in every single expense. We're talking ad spend, of course, but also team salaries, software licenses, agency retainers, and any other overhead tied to the effort.
This all-in approach is what makes ROI the ultimate test of business health. A positive ROI tells you that your entire engine—from marketing and sales to operations—is firing on all cylinders to create real, sustainable growth.
The All-Encompassing ROI Formula
The beauty of the ROI formula is that it cuts straight to what matters: actual profit. It's a much broader and more telling calculation than ROAS.
ROI = (Net Profit / Total Cost of Investment) x 100
Here, Net Profit is simply Total Revenue - Total Cost of Investment. This forces you to look at the complete financial picture, so you don't fall into the trap of celebrating revenue growth that isn't putting money in the bank.
A Comprehensive SaaS Example
Let's continue with our SaaS company example to see just how different ROI and ROAS can be. Imagine your company is running a big push to land new enterprise clients.
- Revenue: The campaign brought in $60,000 in new subscription revenue.
- Ad Spend: Your total ad spend for the campaign is $10,000.
- Other Costs: But that's not the whole story. You also had other expenses:
- $15,000 in salaries for the marketing and sales folks involved.
- $5,000 for new analytics software and content tools.
- Total Investment: $10,000 (Ads) + $15,000 (Salaries) + $5,000 (Tools) = $30,000.
First, let's figure out the Net Profit:
- Net Profit = $60,000 (Revenue) - $30,000 (Total Investment) = $30,000
Now we can plug that into the ROI formula:
- ROI = ($30,000 / $30,000) x 100 = 100%
A 100% ROI is fantastic. It means for every dollar you put into the entire initiative—ads, people, and tools—you got that dollar back, plus another dollar in pure profit. You doubled your money. This is the sign of a truly healthy, profitable venture.
This example really drives home why ROI is the ultimate benchmark. The campaign's ROAS was a stellar 6:1 ($60,000 Revenue / $10,000 Ad Spend), which looks great on a marketing dashboard. But only the ROI calculation confirmed the entire effort was genuinely profitable after all the bills were paid.
By making ROI a core part of your strategy, you can make smarter, more sustainable decisions. And when you have deep insights into what competitors are spending, those decisions get even sharper. You can see how to use revenue intelligence to get a clearer picture of the market. At the end of the day, ROI ensures you're building a business with a rock-solid financial foundation, not just one with flashy top-line numbers.
The Hidden Danger of Chasing a High ROAS
A high Return on Ad Spend (ROAS) can feel like a huge win. When you see a 4:1 or 5:1 ratio on your dashboard, it’s easy to think your ad campaigns are crushing it. But this is exactly where the roas vs roi distinction becomes critical. Focusing only on ROAS can create a dangerous blind spot, masking an unprofitable business that’s burning cash despite impressive-looking revenue.
The problem is that ROAS, by design, ignores every cost outside of direct ad spend. It’s a great thermometer for ad efficiency, but it tells you nothing about your actual, bottom-line profitability. It doesn’t see salaries, software subscriptions, customer support costs, or server fees. Once you factor in these essential operational expenses, a celebrated ROAS can quickly unravel into a negative ROI.
The Profitability Illusion: A Clear Example
Let’s walk through a common SaaS scenario that shows this problem in action. Imagine your company launches a new campaign and gets what looks like fantastic results.
- Ad Spend: You invest $10,000 in ads.
- Revenue Generated: The campaign brings in $40,000 in new subscription revenue.
At first glance, this is a massive success. The ROAS calculation is simple and looks great:
$40,000 (Revenue) / $10,000 (Ad Spend) = 4:1 ROAS
Any marketing team would be thrilled with a 400% return. But the story changes completely once we look at the full investment required to support this campaign and actually deliver the product.
Uncovering the True Costs
To get to real profitability, we need to account for all the other expenses that made this revenue possible. Let's say your operational costs for the month were:
- Salaries & Contractor Fees: $25,000
- Software & Infrastructure: $5,000
- Customer Support & Onboarding: $5,000
Now, we can calculate the Total Investment:
$10,000 (Ads) + $35,000 (Operational Costs) = $45,000
Suddenly, the total investment is much higher than just the ad spend. This is the number that truly matters for your business's health.
With this complete picture, let's calculate the real ROI:
- Net Profit: $40,000 (Revenue) - $45,000 (Total Investment) = -$5,000
- ROI: (-$5,000 / $45,000) x 100 = -11.1% ROI
The business achieved an impressive 4:1 ROAS but still ended up with a negative 11.1% ROI. For every dollar invested across the board, they lost over 11 cents. This is the hidden danger of a ROAS-only mindset.
This isn't just a hypothetical exercise. The gap between ROAS and ROI is a fundamental challenge for SaaS founders. Industry analysis has documented real cases where a company with a healthy-looking 2.5:1 ROAS later discovered its true ROI was -16.67% once all costs were factored in. This happens because ROAS only measures surface-level revenue from ads, ignoring the significant costs of customer acquisition, product delivery, and operations. You can explore more about how these metrics differ and see additional case studies on HubSpot.
A dashboard like the one below from a tool like Proven SaaS can help you spot competitors with sustained ad spend, which often signals a strong ROAS.
But as our example shows, founders have to use this intelligence as a starting point. The real work is digging into your own financials to see if that high ad spend actually translates to profit. Chasing a competitor's high ROAS without understanding their (or your own) complete unit economics is a recipe for scaling an unprofitable company. Sustainable growth comes from making sure your entire business model—not just your ad campaigns—is financially sound.
Choosing the Right Metric for the Right Goal
Knowing the definitions of ROAS and ROI is just the first step. The real magic happens when you know exactly which one to use—and when. This isn't about which metric is "better." It's about which one answers the right question, for the right person, at the right time.
Think of it this way: are you looking through a microscope or a telescope?
For the marketing team deep in the trenches, ROAS is the go-to, day-in-day-out tool. It's the immediate feedback loop they need to manage live ad campaigns. A paid media specialist relies on ROAS to decide whether to pump more money into a high-performing ad set on Meta, kill a keyword on Google that’s burning cash, or shift budget between channels to find the best bang for their buck. It's a tactical metric for real-time optimization.
On the other hand, for founders, CEOs, and the C-suite, ROI is the compass for big-picture strategic planning. It answers the high-stakes questions that shape the company's future. Is our entire marketing engine—salaries, software, and all—actually profitable? Should we pour capital into a new, unproven channel? Is our growth model built to last? ROI steers these crucial, make-or-break decisions.
Aligning Metrics with Roles and Objectives
Different people in a SaaS company have different goals, and their primary metric should reflect that. A campaign manager’s success is measured by ad efficiency. A founder’s success is measured by overall business profitability. When those are confused, teams end up chasing vanity metrics that don't actually help the company's bottom line.
Marketing Teams (The Campaign Optimizers): Their main job is to squeeze every last drop of revenue from their ad budget. ROAS is their north star because it’s a direct measure of ad spend efficiency, letting them tweak campaigns on the fly.
Founders & Leadership (The Business Strategists): Their focus is on sustainable, profitable growth for the entire company. ROI is their critical metric because it gives them a complete picture of profitability, factoring in every single cost.
This flowchart is a great way to visualize how a simple ROAS check can lead to a much deeper, more strategic ROI evaluation.
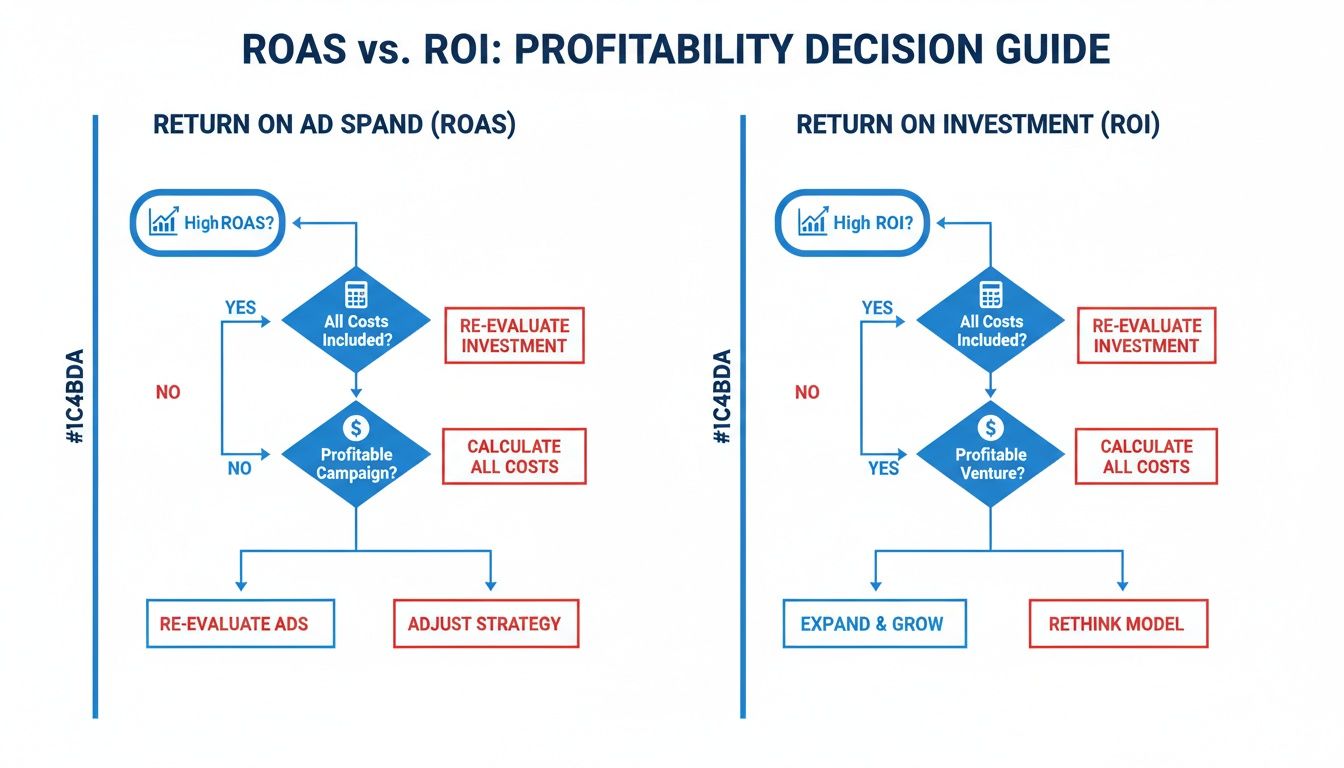
As you can see, a strong ROAS is just the first green light. Real success is only confirmed once you account for all your other costs and prove the entire effort was actually profitable.
When to Prioritize Each Metric
Picking the right metric comes down to the decision you're trying to make right now. Don't think of it as ROAS vs. ROI; think of them as two different tools in your belt. You wouldn't use a hammer to drive a screw, and you shouldn't use ROAS to judge your company's overall financial health.
ROAS is for optimizing the engine while it's running. ROI is for deciding if you should have built that engine in the first place.
Decision Matrix: When to Use ROAS vs. ROI
To make it even clearer, here's a practical guide for different roles inside a SaaS company. Use this matrix to figure out which metric should be front and center based on your immediate objective.
| Scenario or Goal | Primary Metric to Use | Why It's the Right Choice |
|---|---|---|
| Evaluating daily ad performance | ROAS | Gives you immediate, specific feedback on how well your ads are working. |
| Deciding on the annual marketing budget | ROI | Shows the total profitability of past marketing investments to inform future spending. |
| A/B testing ad creatives or copy | ROAS | Directly compares which ad variant is better at generating revenue from spend. |
| Assessing a product launch's success | ROI | Calculates the true net profit after factoring in all development, marketing, and operational costs. |
| Scaling a proven ad channel | ROAS | Confirms that efficiency holds up as you increase your ad spend. |
| Considering a company-wide pivot | ROI | Determines if a fundamental shift in business model will actually be profitable. |
By deliberately choosing your metric to match the goal at hand, you get everyone on the same page. From the marketing intern to the CEO, each person is using the right data to make smarter, more impactful decisions. This alignment elevates the conversation from just hitting numbers to building a truly sustainable strategy.
Building a Dashboard to Track Both Metrics
Knowing the difference between ROAS and ROI is a great start, but the real magic happens when you can track them together. To make this happen, you need a dashboard that brings both your tactical ad performance and your overall business profitability into one clear view. This isn't just about dumping data into a spreadsheet; it's about creating a single source of truth that gets your entire team on the same page.
A well-built dashboard connects the dots. It shows how the marketing team's day-to-day efforts directly impact the big-picture financial health that the leadership team lives and breathes.
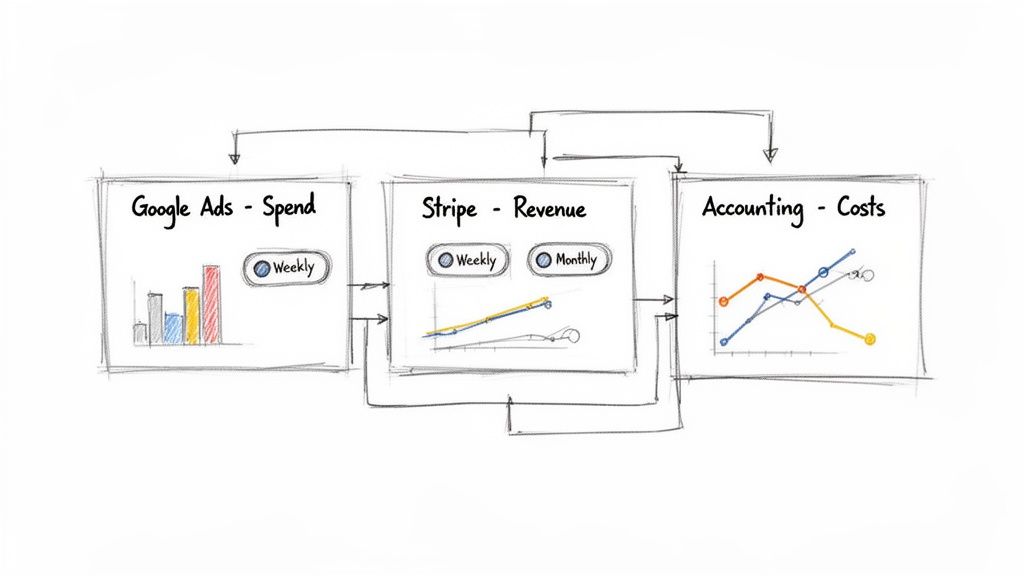
Connecting Your Key Data Sources
To get a truly useful dashboard, you have to pull data from three core parts of your business. Think of them as the essential ingredients for your financial reporting recipe.
- Advertising Platforms (for Ad Spend): This is where your ROAS calculation begins. You'll need to connect directly to platforms like Google Ads and Meta Ads to pull in real-time ad spend and the revenue directly attributed to specific campaigns.
- Payment Processors (for Revenue): This gives you the ground truth on revenue. By integrating with a tool like Stripe, you get an accurate, live feed of sales data that you can then trace back to your marketing activities.
- Accounting Software (for Total Costs): This is the missing piece for a true ROI picture. Linking your accounting software, whether it's QuickBooks or Xero, lets you import all the other business costs—salaries, software subscriptions, rent, and other overhead.
When you bring these sources together, you finally see the complete roas vs roi story. You can see a campaign that looks great with a 4:1 ROAS sitting right next to the -5% ROI it actually delivered once every single business cost was factored in.
Choosing the Right Tools for the Job
You don’t have to overcomplicate this. The best tool is simply the one that fits your current stage and technical skill level.
- Simple Spreadsheets (Google Sheets, Airtable): For early-stage startups, this is often the perfect place to start. You can use simple connectors like Zapier to automatically pull data from your different tools into one sheet. It requires a bit of manual work but forces you to understand the fundamentals.
- BI Platforms (Looker Studio, Tableau): As your business grows, these tools provide more horsepower and automation. They can connect to dozens of data sources and create dynamic dashboards that update automatically. Looker Studio is a fantastic free option that packs a serious punch.
The goal isn't to build the most complex dashboard. It's to create the clearest one. Start simple and add complexity only when the business question you're trying to answer demands it.
Establishing a Reporting Rhythm
A dashboard is worthless if nobody looks at it. Setting up a consistent reporting rhythm is what turns data into decisions and keeps everyone aligned.
Here’s a practical schedule that works well for many SaaS companies:
- Weekly ROAS Check-ins: The marketing team huddles up to review campaign-level ROAS from the past week. This is their chance to optimize spend, kill underperforming ads, and double down on what’s working.
- Monthly ROI Reviews: Founders and leadership get together to look at the full ROI picture. This meeting is for making bigger, strategic calls about the overall marketing budget and its impact on the company's profitability.
This two-track cadence allows your team to be nimble and reactive with ad performance (ROAS) while still maintaining a steady, long-term focus on business health (ROI).
Common Questions About ROAS vs ROI in SaaS
Even when you know the difference between ROAS vs ROI, applying them to a SaaS business can get tricky. The whole subscription model brings its own set of challenges, and you have to be a bit more thoughtful. Let's tackle some of the most common questions founders ask.
How Do I Calculate ROAS for a SaaS Model with Recurring Revenue?
This is a great question. You can’t calculate ROAS for a SaaS company the same way you would for a one-time e-commerce purchase. Since the money keeps coming in, you have to pick a specific timeframe to make the calculation meaningful.
A good, practical starting point is to measure ROAS against the initial contract value or maybe the first few months of subscription revenue—say, a 3-month LTV. This approach keeps the metric timely and gives you something you can actually use to tweak your campaigns right away.
For instance, let's say you spend $1,000 on ads and sign up 10 new customers who each pay $50/month. In the first month, you've made $500, which gives you a ROAS of 0.5:1. Not great. But after three months, that same group of customers has generated $1,500 in revenue, bumping your ROAS up to a much healthier 1.5:1.
Can I Have a High ROI but a Low ROAS?
Absolutely. It's less common, but it definitely happens. This scenario usually plays out when a business is really profitable overall, but most of its customers don't come from paid ads.
Picture a SaaS company that gets most of its growth organically. Maybe they have fantastic word-of-mouth, strong SEO, or a killer direct sales team. The business as a whole could have an incredible ROI. Then, they decide to dip their toes into paid ads with a $5,000 campaign that only pulls in $2,500 in new revenue—a 0.5:1 ROAS. Their advertising is clearly not working.
In this case, the high ROI proves the business model is solid. The low ROAS is just a red flag that paid advertising is either the wrong channel for them, or their campaigns need a serious overhaul.
What Tools Can Help Me Track Both Metrics Effectively?
You'll need a few different tools to get a handle on both metrics, and they really need to play nicely together.
- For ROAS: Your first stop is always going to be the ad platforms themselves, like Google Ads and Meta Ads Manager. Marketing analytics tools can also pull all this data into one place for you.
- For ROI: This is where you have to connect the dots. You can start simple with Google Sheets or Airtable. But for a more automated and powerful setup, you’ll want to look at business intelligence (BI) platforms like Tableau or Looker Studio. Tools like Baremetrics or ProfitWell are also fantastic because they hook right into your payment and accounting software to give you the full profitability picture.
By getting the right tools in place, you can build a dashboard that gives you a clear, accurate view of how efficient your ads are and how profitable your business truly is.
Ready to stop guessing and start building on proven ideas? Proven SaaS uses AI to analyze millions of ads, uncovering profitable SaaS niches with validated market demand. Find your next great idea today.
Discover Profitable SaaS Ideas
Build SaaS That's
Already Proven.
14,500+ SaaS with real revenue, ads & tech stacks.
Skip the guesswork. Build what works.
Trusted by 1,800+ founders