Forget customer surveys. The surest sign of a profitable market is seeing competitors spend big money on ads, month after month. It's proof that a real problem exists and people are already paying to solve it.
Conducting a competitor ad spend analysis de-risks your entire venture. It shifts your focus from "Will people pay for this?" to "How can I build a better solution for this proven demand?"
Why Ad Spend is the Ultimate Market Signal
Customer discovery calls can be misleading. People often say they'll pay for something, but their wallets tell a different story. Competitor ad spend cuts through that noise.
When a company pours thousands of dollars into ads every month, it's a calculated investment, not a gamble. They've found a message that resonates, an audience that converts, and a problem painful enough to make their ads profitable. This is what product-market fit looks like in the wild.
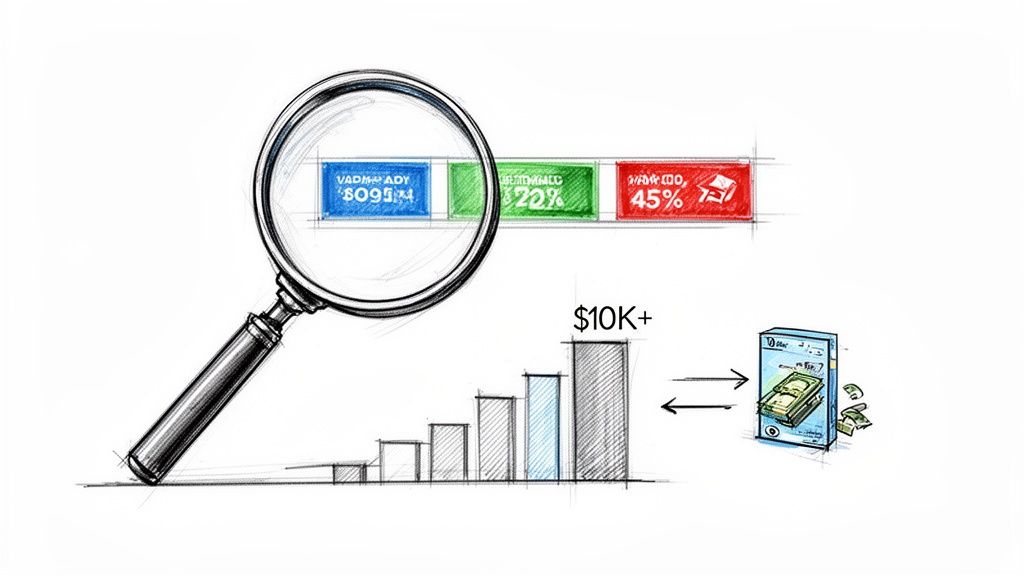
The $10k/Month Litmus Test
So, why focus on competitors spending over $10,000 a month on platforms like Meta? This figure is a strong indicator of real revenue. A company can't burn that much cash for long unless its Customer Acquisition Cost (CAC) is profitable and revenue is flowing. Simply put, they've done the hard work of validating the market for you.
Your job isn't to reinvent the wheel. It's to build a better one. By focusing on where the money is already flowing, you step into markets ready to buy.
The scale of this is massive. In 2025, global ad spending is set to surpass $1 trillion, hitting an estimated $1.14 trillion. This explosion means fierce competition, but for a savvy founder, it's a goldmine. Competitors spending heavily on platforms like Meta are essentially pointing giant flashing arrows at profitable niches. You can find more details on this advertising growth to understand its impact.
Moving From Guesswork to a Real Strategy
Tracking ad spend moves you from speculation to strategy. You can see with clarity:
- Which problems are worth solving: High ad spend points directly to high-value customer pain points.
- What messaging converts: Your competitors have already A/B tested their copy, images, and offers. Learn from their results.
- Who the ideal customer is: The ads themselves reveal the exact demographics and interests being targeted.
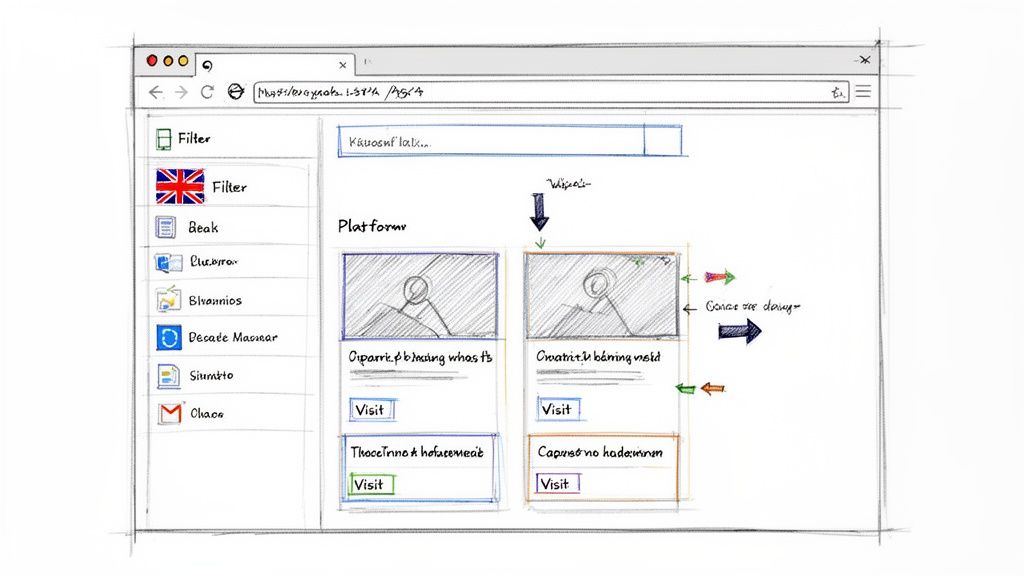
A great place to start your research is the Meta Ad Library, a public database showing every active ad on Meta's platforms.
This simple search bar is your window into which companies are actively buying customers. By following these financial breadcrumbs, you can uncover entire business models that are working right now.
When you analyze competitor ad spend, you're not just looking at ads. You're reverse-engineering a successful business. You're identifying a validated customer problem and finding a proven path to revenue—all before writing a single line of code.
How to Use the Meta Ad Library for Research
Your first stop for any serious competitor ad analysis is the Meta Ad Library. It’s a public, searchable database of every ad running on Facebook and Instagram. For founders trying to validate a niche, this transparency is invaluable.
But just browsing won't get you far. You need a system. The goal is to build a dataset of ad creatives, landing pages, and messaging angles that you can analyze for patterns.
Think of the Ad Library as a search engine, not a social feed. Start with broad keywords related to your niche, but quickly narrow your focus to find the ads that truly matter.
How to Refine Your Search
A generic search will bury you in irrelevant ads. Use filters and specific queries to zero in on the SaaS companies you care about.
Combine filters to cut through the noise:
- Country Filters: Targeting the US or UK? Isolate ads running in those regions to understand market-specific messaging.
- Platform Selection: Are they focused on Instagram Stories? Or running ads on the Facebook Audience Network? Filter by platform to see where their budget is going.
- Keyword Searches: Get creative. Go beyond obvious terms. Search for phrases from competitor calls-to-action (CTAs), like "Get your free demo" or "Start your 14-day trial."
This granular approach makes a huge difference. For example, instead of just searching "project management," try searching for a competitor's brand name, like "Asana," and then filter for ads running only in the United States on Instagram. Instantly, you see their exact creative for that audience.
The most powerful insights come from a well-defined search. Don't just look for ads in your category; look for the specific ads from the specific competitors you need to understand.
Advanced Tactics to Uncover Hidden Campaigns
Once you've mastered the basics, use advanced tactics to find what others miss.
A powerful technique is to search for competitor brand names directly. This reveals every ad they're running, giving you a complete snapshot of their campaigns.
Another favorite method is to analyze the ad copy itself. Let's say you notice several CRM competitors use the phrase "never miss a follow-up." Searching that exact phrase can reveal smaller, up-and-coming players using similar hooks. It's a fantastic way to map out the competitive landscape beyond the big names.
To see real-world examples of how top SaaS companies structure their campaigns, our in-depth look at the Proven SaaS ad library breaks down the patterns used by the most successful advertisers.
When you find an interesting ad, don't stop there. Dig deeper:
- Follow the Funnel: Click the ad. Where does it lead? A homepage, a feature page, or a sign-up form? This reveals their funnel strategy.
- Check Their Socials: Visit the company’s Facebook or Instagram page. This provides context on their broader content strategy and how ads fit with their organic posts.
- Log the Creative: Save the ad creative URL. Over time, build your own swipe file to track how competitor messaging and design evolve.
This process transforms you from a casual observer into a data collector. Every ad, landing page, and piece of copy is another piece of evidence in building a clear picture of their go-to-market strategy.
What to Actually Collect from Each Ad
To make this process systematic, use a checklist. This ensures you build a consistent, high-quality dataset that you can analyze later.
Here’s a simple table to guide your data collection for each ad:
| Data Point | Why It Matters | Example |
|---|---|---|
| Advertiser Name | Links the ad to a specific competitor. | "Notion" or "ClickUp" |
| Ad Creative (URL/Screenshot) | Captures their visual and messaging style. | Link to the ad or a saved image. |
| Ad Copy | Reveals their core value prop, hooks, and CTAs. | "The all-in-one workspace for your team." |
| Start Date | Shows how long an ad has run (a proxy for success). | "Started running on June 5, 2023" |
| Landing Page URL | Shows where they send traffic and what the funnel is. | https://competitor.com/demo |
| Platform(s) | Tells you where they focus their ad spend (FB, IG). | "Facebook, Instagram" |
| Observed Country | Shows which geographic markets they are targeting. | "United States" |
Organizing this information in a spreadsheet is the foundation for all the analysis that follows. It's some upfront work, but it's what allows you to spot patterns and make smarter decisions.
Tying Ads Back to Companies and Estimating Their Revenue
You have a list of ad links from the Meta Ad Library. That’s a good start, but it's just raw data. The real value comes when you connect each ad to a specific company and estimate how much money they might be making from it. This is how you turn data into a strategic map of profitable businesses.
The Detective Work: Attribution
Connecting an ad to the company behind it is like detective work. Your biggest clue is the landing page URL. Click the ad, and the domain will usually tell you who you're looking at.
From there, look for brand names, logos, or unique phrases in the ad copy. This manual step is crucial for an accurate picture of the competitive landscape.
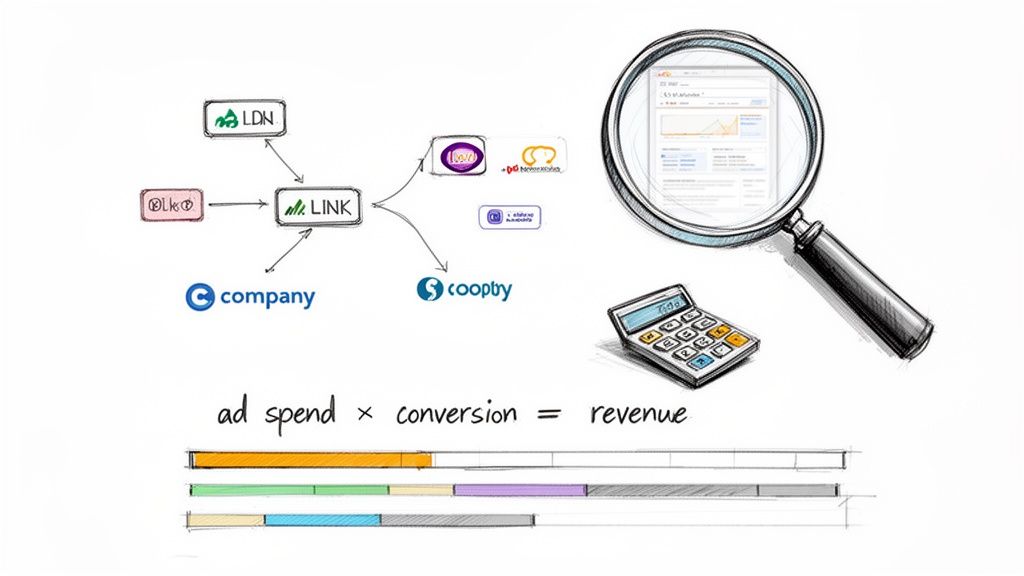
From Ad Spend to a Revenue Model
Once you've linked ads to SaaS companies, translate their ad activity into a rough financial model. The goal isn't perfect numbers; it's a reasonable estimate to see if the market is viable.
You can build a surprisingly effective model using the number of ads they're running, how long they've been running, their public pricing, and some industry benchmarks for customer acquisition cost (CAC). An ad that’s been live for six months is almost certainly profitable. No company burns cash on a losing campaign for that long.
This involves some educated guesswork, but it's far better than pure speculation. For a deeper dive, our guide on how to estimate SaaS revenue provides more detailed models.
Example: A Quick Framework for Estimating Revenue
Let's make this practical. Imagine you find a competitor, "SaaS-X," running 10 different ad creatives on Instagram for the past three months.
Here’s a simple way to estimate their potential revenue:
- Estimate Ad Spend: With 10 ads running for months, a conservative guess might be $500 per day in total, which is $15,000 per month. Sustained spend like this is a massive signal.
- Find Their Pricing: You visit their website and see their most popular plan is $49 per month.
- Apply CAC Benchmarks: A healthy SaaS business often aims to recover its CAC in 6 to 12 months. Let's use a 6-month payback period. This puts their target CAC at roughly $294 ($49 x 6).
- Calculate New Customers: If they spend $15,000 per month with a target CAC of $294, they're likely acquiring around 51 new customers each month from this campaign ($15,000 / $294).
- Model Monthly Recurring Revenue (MRR): At 51 new customers per month, each paying $49, this single campaign generates about $2,499 in new MRR monthly.
This simple calculation turned a few ad observations into a real business metric. It shows you there's a profitable way to find customers for this kind of product.
This back-of-the-napkin math is incredibly powerful. It’s not about getting the numbers perfect; it's about confirming that a real, profitable market exists where companies can spend money on ads and acquire customers at a sustainable cost.
Why This is So Important for Validating Your Niche
This analysis is a fundamental part of validating your idea. It helps you understand the business mechanics behind a shiny product.
The global shift to digital advertising is huge. Digital ad spend is projected to hit $740 billion by 2025, about 69% of all ad budgets. When you see a competitor sustain their ad spend, it's a direct signal that a niche has proven traction.
Ultimately, this process helps answer the most important question before you build anything: is there hard evidence that people will pay for a solution to this problem? If you find multiple competitors profitably acquiring customers through ads, you've likely found a market worth entering.
Reading the Tea Leaves: Spotting Growth vs. Saturation
You've connected ads to companies and sketched out some rough revenue models. You have a list of profitable-looking competitors. Now what?
This is where the art of analysis comes in—learning to tell the difference between a thriving, open market and a saturated one. This is how you decide which fights are worth picking.
What Real Growth Signals Look Like
You're looking for signs of momentum. Positive growth signals are dynamic and show a company reinvesting in ads because they're working.
Look for these tell-tale signs:
- Exploding Ad Volume: A company that goes from running 5 ad variations to 50 in two months has struck gold. They are scaling aggressively to capture the market.
- Constant A/B Testing: Are they testing one message with ten different images? Or one image with five different headlines? This is the mark of a sophisticated operation that is fine-tuning its campaigns for maximum performance.
- Expanding into New Countries: When a SaaS business starts targeting ads to the UK, Canada, or Australia, it’s a huge vote of confidence. It means their core offer is working so well that they're betting it will work elsewhere.
A competitor aggressively testing and scaling their ad campaigns is one of the best forms of validation you could ever ask for. They're spending their own money to prove your target market is ready and willing to buy.
Red Flags of a Saturated Market
Knowing when to walk away is just as critical as spotting growth. High ad spend can sometimes lead to a crowded market with razor-thin margins.
Here’s what a saturated market looks like:
- Identical Ad Copy and Offers: If a dozen competitors are all using the same headlines and pain points, it’s a sign of creative exhaustion. The market is so crowded that imitation has replaced innovation.
- A Race-to-the-Bottom on Pricing: See ads promoting "Cheapest Solution" or "50% Off Lifetime"? Run. This signals the conversation has shifted from value to price—a dangerous game for a newcomer.
- Low Creative Diversity: In a stale niche, the ads all look the same. Everyone uses the same stock photos and tired messaging. This creative stagnation is a huge red flag.
A Real-World Example: Weighing the Odds
Let’s say you’re researching the "AI meeting assistant" space. Your analysis splits the players into two camps.
Group A includes five companies. They are constantly testing new ad creatives. One just launched campaigns in Europe. Their ad copy focuses on specific outcomes, like "cut meeting follow-up time by 80%." They aren't the cheapest. These are strong growth signals.
Group B is a crowd of 20+ competitors. Their ads are a sea of sameness, with generic promises like "Never miss a word." Most are battling on price with headlines like "The most affordable AI notetaker." This market is screaming saturation.
The real opportunity is clearly with Group A. There's competition, but the market has proven demand and there’s still room to innovate on messaging or positioning. Your ad spend analysis just helped you sidestep the bloodbath of Group B and pinpoint a niche with a proven pulse and room to grow.
Your Framework for Rapid Niche Validation
All this data collection boils down to a repeatable plan that can quickly tell you if a SaaS idea is a winner or a dud. A good ad spend analysis is your shortcut to finding a hungry market and launching with confidence.
Instead of burning months on a hunch, you can follow a clear, data-driven timeline, using the market validation your competitors have already paid for.
From Discovery to Launch A Simple Timeline
You can compress a validation cycle that normally takes months down to just a few weeks.
Day 1: Find Your Validated Niche
Your first day is about discovery. Dive into ad libraries and look for SaaS companies consistently spending over $10,000 a month on ads. This filter immediately points you toward niches with profitable demand. Just start a list.
Week 1: Build a Targeted MVP
With a list of profitable competitors, dissect their ad angles and landing pages. What specific problems are they solving? This week, concept a minimum viable product (MVP) that solves one of those core problems, but perhaps better or for a more specific audience.
Month 1: Launch Where They Are
You now know which channels your competitors use to find customers. Launch your MVP on those same platforms. If they're all over LinkedIn ads, start there. This removes the guesswork and puts your solution in front of an audience that's already looking for it.
Structuring Your Niche Research
To keep everything organized, you need a simple system. A basic spreadsheet is all you need to turn random observations into a powerful decision-making tool.
Start with these columns:
- Company Name: The competitor you're researching.
- Estimated Ad Spend: Your quick calculation of their monthly ad budget.
- Key Ad Angle: The main pain point or value prop in their ads.
- Opportunity Score: A simple 1-5 rating based on growth signals and market saturation.
This structure keeps you focused. For founders who want to move faster, a good SaaS niche validator tool can automate much of this data gathering.
Your goal isn't to create a perfect, exhaustive report. It's to build a working document that helps you make a fast, informed decision about which market to enter next.
Pitfalls to Avoid in Your Analysis
As you work, watch out for a few common traps. Misreading the data is as dangerous as having no data at all.
A big mistake is mistaking a short-term ad test for a sustained campaign. A company might run an ad for a week and kill it. That's not validation. Only pay attention to ads that have been running for 30 days or more—that’s a much stronger signal of profitability.
Another pitfall is obsessing over a single competitor. One company's success could be a fluke. To truly validate a niche, look for a cluster of three to five competitors all successfully acquiring customers with ads. This pattern suggests a healthy market ecosystem.
The Opportunity Prioritization Framework
To make sense of your findings, use a simple scoring system. This helps you rank potential niches and weigh the signals you've uncovered.
| Factor | Scoring Criteria (1-5) | Why It's a Key Indicator |
|---|---|---|
| Sustained Ad Spend | 1 (Low, <$5k/mo) to 5 (High, >$50k/mo) | High, consistent spend proves a profitable customer acquisition model exists. |
| Competitor Density | 1 (Saturated) to 5 (Underserved) | Look for 3-5 players. Too many is a red flag; too few might mean no market. |
| Creative Diversity | 1 (Stale, identical ads) to 5 (High, frequent testing) | Active testing of new angles and visuals signals a healthy, growing market. |
| Differentiation Angle | 1 (No clear opening) to 5 (Obvious gap) | How easily can you find a unique position (e.g., price, features, target audience)? |
After scoring a few potential niches with this framework, the path forward usually becomes much clearer. The ideas with the highest scores are your top candidates.
This whole process is about clarity. Prioritize niches that show clear signs of growth, like diverse ad creatives and new market expansion. Be wary of red flags like identical messaging and desperate price wars. By sticking to this framework, you can systematically de-risk your next venture and start building for a market that's already proven to exist.
Answering Your Top Questions About Ad Spend Analysis
Even with a solid framework, some questions always come up. Here are answers to the most common ones.
How Accurate Are These Ad Spend Numbers, Really?
This is a fair question. It's critical to understand that any numbers you calculate are well-informed estimates, not exact figures. Platforms like the Meta Ad Library don't show you a competitor's spending receipt. We model it based on clues like how long an ad has been running, how many creatives they're testing, and typical customer acquisition costs (CAC) in their industry.
For example, if a company runs the same ad for six months straight, that's a massive signal. While we don't know the exact dollar amount, we can be confident the ad is profitable. The goal isn't perfect precision; it's getting enough directional evidence to prove a profitable market exists.
Can I Just Stick to the Ad Library?
The Meta Ad Library is an amazing resource, but it's only one piece of the puzzle. To get the full picture, you need to pull in data from other places.
The Ad Library shows you what competitors are advertising, but other sources tell you why.
- Their Website: Check their pricing page. Does it match the offers in their ads?
- Social Media: What are they talking about on their organic profiles? Does it align with their paid messaging?
- Review Sites: Are customers complaining about a specific missing feature? That could be your unique angle.
Connecting these dots moves you from simple ad analysis to real strategic insight.
The real magic happens when you synthesize data from multiple sources. The Ad Library shows you where the money is going; their website and social media tell you what they're trying to accomplish with that spend.
Is It Better to Look for More Ads or Better Ads?
It's easy to be impressed by a competitor testing hundreds of ad creatives, but this can be a red herring. A company frantically throwing 100 different ads against the wall might be struggling more than a competitor with five killer campaigns that just work.
Sustained performance is what you're looking for. An ad that has been running consistently for 30-60 days is a much stronger signal of success than a dozen new ads that vanish after a week. Focus on the ads that have proven their staying power—those are the ones driving revenue.
How Do I Tell If a Niche Is Just Too Crowded?
Finding three to five competitors successfully running ads is a fantastic sign of a healthy, validated market. But what if you find 20 or more? If they're all using the same talking points and trying to undercut each other on price, you've likely found a saturated, "red ocean" niche.
You want to see creative diversity. If every ad looks and sounds the same, the playbook is already written, making it tough for a newcomer to stand out. The best opportunities are often in markets with proven demand where competitors haven't yet figured out all the angles. That’s your opening.
Stop guessing and start building with confidence. Proven SaaS uses AI to analyze competitor ad spend, model revenue, and surface validated SaaS ideas in minutes. Find your next profitable niche today.
Build SaaS That's
Already Proven.
14,500+ SaaS with real revenue, ads & tech stacks.
Skip the guesswork. Build what works.
Trusted by 1,800+ founders