When you're running paid ads for a B2B SaaS, it's easy to wonder, "Are my numbers any good?" Benchmarks give you that crucial context. As a rule of thumb, you might see a Google Ads Click-Through Rate (CTR) of around 3%, a LinkedIn Ads CTR of approximately 0.6%, and a Meta Ads conversion rate hitting over 10% for lead generation.
These figures aren't just trivia—they're your reality check. They help you understand if your campaigns are hitting the mark or if there’s room for serious improvement.
Your Quick Reference Guide to B2B SaaS Ad Benchmarks
Diving into paid advertising without knowing the typical performance metrics is like trying to navigate a new city without a map. You're spending money, but you have no idea if you're actually getting anywhere. This is why having reliable benchmarks is so important.
For SaaS founders and marketers, a quick-glance guide is a lifesaver. It lets you skip the dense, time-consuming reports and get straight to the point. With a clear view of key performance indicators (KPIs) across the big channels, you can instantly see where you're winning and where you're falling behind. This data is the foundation for setting realistic goals, justifying your ad budget, and deciding which channels are worth doubling down on.
Core B2B SaaS Advertising Benchmarks at a Glance
So, what should you be aiming for? The table below breaks down the essential performance benchmarks for B2B SaaS across the most popular ad platforms.
| Metric | Google Search Ads | Google Display Ads | LinkedIn Ads | Meta (Facebook/Instagram) Ads |
|---|---|---|---|---|
| Avg. CTR | 2.5% - 4.0% | 0.4% - 0.7% | 0.5% - 0.8% | 0.7% - 1.1% |
| Avg. CPC | $4.50 - $8.00 | $1.00 - $2.50 | $6.00 - $11.00 | $2.00 - $4.00 |
| Avg. CVR | 3.5% - 6.0% | 0.8% - 1.5% | 4.0% - 7.0% | 9.0% - 12.0% |
Think of these numbers as your starting point. They provide a solid baseline for evaluating your own campaign data and spotting areas that need a closer look.
If you want to go deeper and see how these numbers change based on company size, ad spend, or funnel stage, check out our complete guide on SaaS advertising benchmarks on proven-saas.com for a more detailed analysis.
Decoding Key Advertising Metrics for SaaS
Before you can really dig into B2B SaaS advertising benchmarks, you have to get a handle on what the core metrics actually mean for a subscription business. These aren't just numbers on a dashboard; they tell the story of your customer's journey and the health of your campaigns.
It's a classic—and costly—mistake to apply generic consumer benchmarks to a specific B2B software product. The sales cycles are way longer, the stakes are higher, and the metrics just don't behave the same way. Getting that context right is everything.
The Essential SaaS Advertising KPIs
It's helpful to think of the advertising funnel in stages. Each metric represents a critical step as a prospect moves from simply seeing your ad, to clicking it, to becoming a lead, and finally, to becoming a paying customer. Each one tells you how well you're doing at that specific stage.
Let's break down the five most important ones.
Click-Through Rate (CTR): This is the percentage of people who saw your ad and actually clicked on it. A high CTR is your first signal that your ad creative and messaging are hitting the mark. It's the first green light for a healthy campaign.
Cost Per Click (CPC): This is simply how much you pay for a single click on your ad. Your CPC is a constant push and pull between competition, ad quality, and how dialed-in your targeting is. For B2B SaaS, don't be shocked by higher CPCs; each click represents a potentially high-value business customer.
The image below gives a simple visual of how these first two metrics, CTR and CPC, feed into the bigger picture of ad performance and the ultimate goal: conversion.
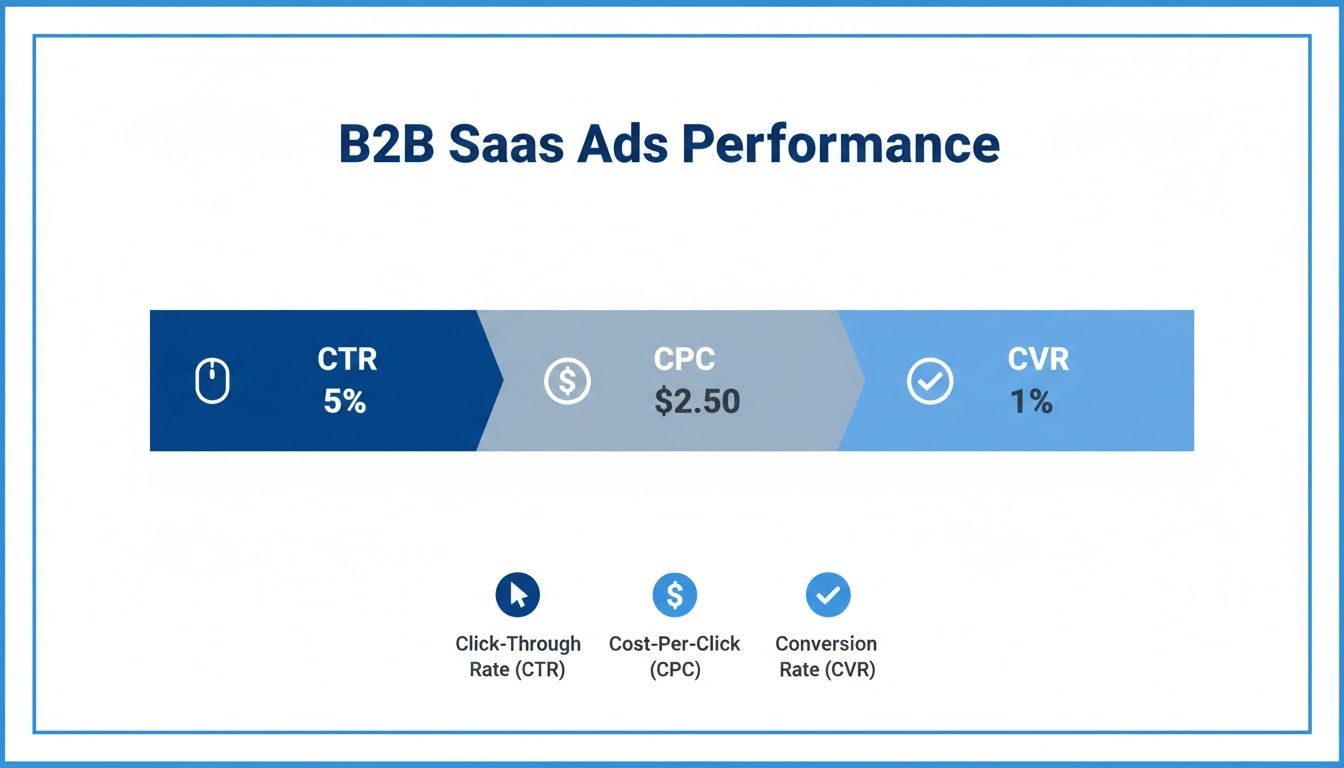
It highlights the relationship between getting attention (CTR), what that attention costs (CPC), and how well you turn it into a real action (CVR).
From Clicks to Customers
Getting the click is just the first step. The real test is turning that click into a business outcome, which is where this next set of metrics comes in.
Conversion Rate (CVR): This tracks the percentage of users who take the action you want after clicking your ad, like signing up for a free trial or booking a demo. A strong CVR tells you that your landing page is doing its job and your offer is resonating.
Cost Per Acquisition (CPA): Sometimes called Cost Per Action, this is your total cost to get one new customer or lead. You just divide your total ad spend by the number of conversions. A sustainable CPA is absolutely critical for staying profitable.
Simple Example: If you spend $2,000 on a campaign that results in 50 demo sign-ups, your CPA is $40 per sign-up ($2,000 ÷ 50). This number gives you a clear, direct cost for acquiring each potential customer.
- Return on Ad Spend (ROAS): This is the bottom line—the ultimate measure of whether your campaign was a financial success. It shows you the total revenue you generated for every dollar you put into advertising. A 3:1 ROAS means you’re making $3 for every $1 you spend. To really get into the weeds on this, check out our guide on ROI vs. ROAS for SaaS profitability.
Google Ads Performance Benchmarks for B2B SaaS
For most B2B SaaS companies, Google Ads is ground zero for paid acquisition. It’s where you go to get in front of people who are actively looking for a solution to their problem. Being right there at the top of the search results when they type in that magic phrase is a massive advantage.
But not all Google Ads campaigns are created equal. The platform is really split into two different worlds: Search and Display. Knowing the difference is crucial for setting realistic goals. Search is all about capturing existing demand, while Display is about creating it. As you’d expect, their performance numbers are miles apart.
Search Ad Benchmarks: Capturing High-Intent Leads
Google Search ads are the workhorse for B2B SaaS. You're bidding on keywords that show someone is ready to buy, which means you'll almost always see higher engagement and conversion rates compared to other channels. The trick is to focus on keywords with strong commercial intent—think "project management software for small teams" instead of a broad term like "project management."
In the cut-throat B2B SaaS space, the latest data gives us a clear picture of what to aim for. For Search campaigns, a good average click-through rate (CTR) to shoot for is 3.2%. The average cost per click (CPC) is sitting around $5.70, and a solid conversion rate is 4.7%. This highlights just how important it is to have your landing pages and offers dialed in. For a deeper look at the numbers, check out the 2025 B2B SaaS Google Ads benchmarks on adlabz.co.
The image below breaks down the anatomy of a solid Google Search ad, showing how all the pieces fit together to drive clicks and conversions.
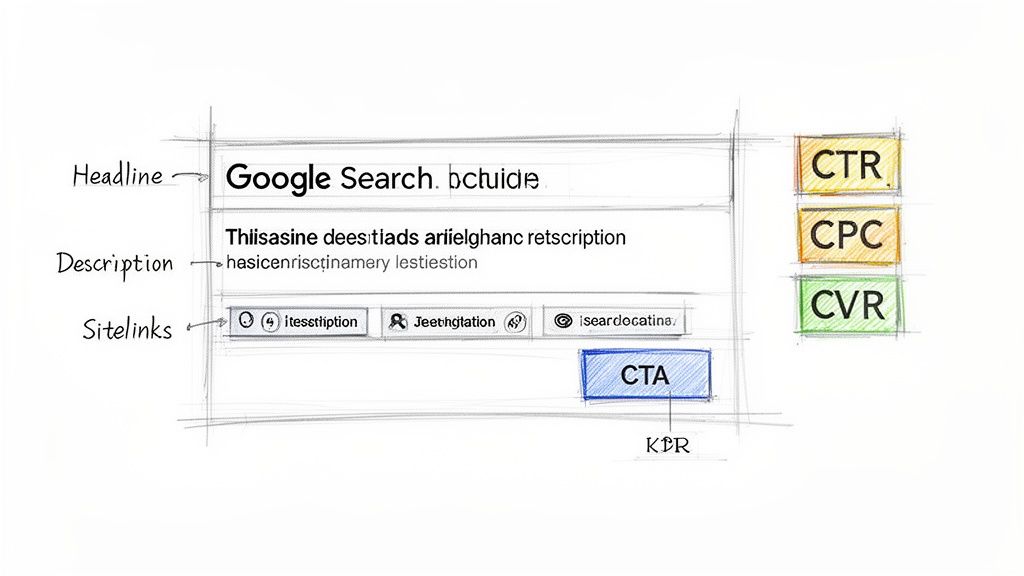
To get anywhere near these benchmarks, your ad copy has to be incredibly sharp and laser-focused on solving a specific pain point.
Example of Effective Ad Copy: An accounting SaaS could use a headline that speaks directly to a prospect's frustration, like "Stop Drowning in Spreadsheets." Follow that with a clear, benefit-driven description: "Automate Invoicing & Expenses. Try for Free." It grabs their attention and offers an instant, tangible solution.
Don't forget to use sitelink extensions. Adding direct links to pages like "Book a Demo" or "View Pricing" makes it easier for users to get where they want to go, and it can give your conversion rates a healthy bump.
Display Ad Benchmarks: Building Awareness
If Search ads are for capturing demand, Google Display ads are for creating it. These are the visual, banner-style ads you see across millions of websites and apps. They're perfect for top-of-funnel brand awareness campaigns and for retargeting people who've already shown some interest.
Because people aren't actively searching when they see a Display ad, the performance metrics look very different. The average CTR for Display is only 0.9% with a CPC of $2.80, and conversions land around 1.2%.
Here's how to think about those numbers:
- Lower CTR is normal: Don't panic. A low click-through rate is totally expected. The goal here is often more about getting eyeballs on your brand (impressions) than immediate clicks.
- Lower CPC is a huge plus: The much lower cost per click makes Display an affordable way to introduce your brand to a massive audience of potential customers.
Simple Example: A project management SaaS can use Display ads to retarget visitors who viewed their pricing page but didn't sign up. A visually appealing banner ad following them across the web serves as a gentle reminder, pulling them back to complete the trial signup.
LinkedIn and Meta Ads Benchmarks for SaaS Companies
While Google Ads is great for people actively searching, you can’t ignore social advertising. Platforms like LinkedIn and Meta (Facebook and Instagram) are fantastic for getting in front of specific professional audiences and creating demand where it didn't exist before. Knowing how each platform works—and what to expect—is crucial for spending your budget wisely.
LinkedIn is king for hyper-specific B2B targeting. Its real power is letting you zero in on users based on their job titles, company size, and industry. This makes it the go-to platform for reaching decision-makers in specific niches.
Meta, on the other hand, is a powerhouse because of its smart algorithms for building lookalike audiences and running retargeting campaigns. Many dismiss it as B2C-only, but it can be a surprisingly cheap and effective channel for B2B SaaS, especially if your product is aimed at SMBs or professionals.
LinkedIn Benchmarks for B2B SaaS
On LinkedIn, you’ll most likely be using Sponsored Content. These are the ads that show up right in a person's main feed, designed to look like a regular post. You're reaching a highly relevant audience, but they aren't actively looking for you, so the costs are higher. The trade-off? The quality of the leads can be much better.
Here’s a realistic look at what you can expect from a typical LinkedIn Sponsored Content campaign:
- Average Click-Through Rate (CTR): 0.5% - 0.8%
- Average Cost Per Click (CPC): $6.00 - $11.00
- Average Conversion Rate (Demo/Trial Sign-up): 4.0% - 7.0%
Example Campaign: Targeting Product Managers Let's say you're selling a roadmap visualization tool. With LinkedIn, you could build a campaign that only targets people with "Product Manager" in their title, who work at software companies with 50-200 employees. You could run an ad with a quick video showing how your tool solves a classic PM headache. That kind of precision is exactly why you're willing to pay a higher CPC.
Meta Ads Benchmarks for B2B SaaS
Meta's biggest advantage is its sheer scale and powerful targeting algorithms. For B2B SaaS, it’s brilliant for retargeting people who’ve already visited your website or for creating lookalike audiences based on your best customers. When done right, lead generation campaigns on Meta can bring in solid results for less money than LinkedIn.
Here are the key benchmarks for a B2B SaaS lead gen campaign on Meta:
| Metric | Meta (Facebook/Instagram) Ads |
|---|---|
| Average CTR | 0.78% |
| Average CPC | $2.52 |
| Average CVR | 10.63% |
| Average CPA | $23.77 |
Those numbers really tell a story. A 10.63% conversion rate is incredibly strong, usually thanks to Meta’s smooth, integrated lead forms and uncanny ability to find the right people.
The lower CPC makes it a great, cost-effective way to fill the top of your funnel, particularly if your SaaS appeals to a wide audience. If you want to get more granular on budget optimization, our guide on Facebook Ads spending for SaaS digs much deeper.
Ultimately, deciding between LinkedIn and Meta really comes down to who you're trying to reach and what you want to achieve with your campaign.
Getting to Grips with Financial Benchmarks Like CAC and ROAS
Clicks and conversions are great, but they're vanity metrics if they don't lead to profit. To really know if your advertising is working, you have to connect your ad spend to actual business results. That's where Customer Acquisition Cost (CAC) and Return on Ad Spend (ROAS) come in.
These two numbers tell you if your business model is actually viable. They answer the questions every founder loses sleep over: "How much does it cost me to land a new paying customer?" and "Is the money I'm pouring into ads actually coming back to me?"
Nailing Your Customer Acquisition Cost
Your Customer Acquisition Cost (CAC) is simply the total sales and marketing cost required to sign up one new customer. When looking just at ads, you can get a quick read by dividing your total ad spend by the number of new customers you got from those ads.
A good CAC is all about efficiency. As you grow, you should get better at acquiring customers. A deep dive into B2B SaaS marketing budgets reveals that as companies scale, their marketing CAC ratios improve significantly. They drop from a median of $1.03 per dollar of New Annual Recurring Revenue (ARR) for smaller startups to just $0.50 for firms in the $50M-$100M bracket. You can explore more of the findings on 2025 B2B SaaS marketing benchmarks to see how this reflects operational maturity.
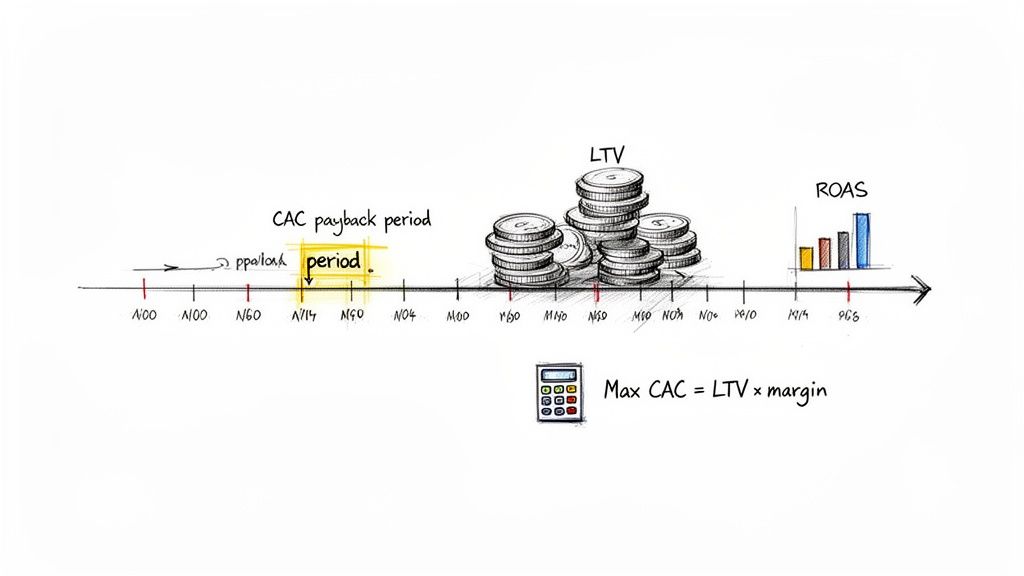
Another key piece of the puzzle is your CAC Payback Period—how many months it takes for a new customer's revenue to cover their acquisition cost. For B2B SaaS, a solid target is to get that money back in under 12 months.
Understanding Your Return on Ad Spend
While CAC looks at the cost per customer, Return on Ad Spend (ROAS) measures the direct revenue you're generating for every dollar spent on advertising. The formula is simple: Total Revenue from Ads ÷ Total Ad Spend. A ROAS of 3:1 means you’re making $3 for every $1 you spend.
What’s considered a "good" ROAS changes dramatically depending on the channel.
- Google Search Ads: Because of high user intent, a 4:1 ROAS is a common and achievable target.
- LinkedIn Ads: This platform is pricier, so a ROAS between 2:1 to 3:1 is often considered a big win.
- Meta Ads: Here, you might be focused on brand awareness. A 2:1 ROAS can be very effective, especially if you have a high Customer Lifetime Value (LTV).
It's critical to remember that there is no universal "good" ROAS. It's completely dependent on your company's profit margins. A high-margin business might be thrilled with a 3:1 ROAS, whereas a low-margin company might need a 5:1 ROAS just to stay afloat.
Putting It All Together: A Practical Example
Let's ground this in reality. Imagine a SaaS company with these numbers:
- Average Subscription Price: $100/month ($1,200/year)
- Gross Margin: 80%
- Target CAC Payback Period: 12 months
First, we figure out the annual gross profit from one customer: $1,200 (ARR) * 0.80 (Gross Margin) = $960.
Since their goal is to pay back the acquisition cost within a year, their absolute maximum allowable CAC is $960. If they find their Google Ads campaign brings in customers for $800 each, that’s a profitable channel. But if their LinkedIn campaign has a CAC of $1,200, they are actively losing money on every new customer and need to fix that strategy—fast.
How to Use Ad Benchmarks to Find Profitable SaaS Ideas
Instead of just guessing what might work, you can use advertising data to see if a SaaS idea has legs before you ever write a single line of code. Think about it: if a company is consistently pouring thousands of dollars into ads every month, it’s a massive signal they've found a profitable market with real customers who are willing to pay.
This whole approach flips the usual startup script. You're not starting with an idea you think people want. You're starting by finding where the demand already exists. By looking at what’s already succeeding, you can seriously de-risk your next big idea.
Spotting Opportunity Through Sustained Ad Spend
Your first job is to play detective. Look for competitors in a niche who are keeping up a significant ad spend over a long period. A single, short-lived campaign doesn't tell you much. But a company spending $10,000+ per month for six months straight? That’s a pretty clear sign they're getting a positive return on that investment and have found a healthy market.
Once you’ve identified these players, dig into their ads. What problems are they highlighting? What kind of language resonates with their audience? Their ad copy is basically a cheat sheet for the pain points customers are desperate to solve.
When you see a competitor scaling their ad budget on a high-ROI channel, it's more than just a data point—it's market validation. It proves that customers in that niche are willing to pay for a solution to their problem.
Analyzing Channel Performance for Viability
Next, see how your target niche's advertising stacks up against industry B2B SaaS advertising benchmarks. If you notice competitors are all-in on LinkedIn, it tells you that high-quality leads are their top priority. If they’re pumping money into Meta, it suggests a broader audience is viable and they're likely chasing a lower customer acquisition cost (CAC).
Getting a handle on channel ROI is everything. For instance, benchmarks show that SEO is a monster, often delivering a 748% ROI. Paid ads on LinkedIn are also a powerhouse for B2B, with a strong 192% ROI and a 2.3 ROAS. It's no wonder so many B2B marketers live on that platform. You can find a complete breakdown and learn more about B2B marketing ROI benchmarks at data-mania.com.
Building a Data-Backed Business Case
With all this information, you can build a rock-solid case for your product idea long before you commit serious resources. You’re no longer running on gut feelings and assumptions. Instead, you have the data to confidently answer the most important questions.
Here’s a simple process to get started:
- Identify High-Spenders: Use a tool like Proven SaaS to pinpoint companies in your potential niche that are spending big on ads.
- Analyze Their Strategy: Study their messaging, what they're offering, and which channels they're focused on. This uncovers what their customers care about.
- Benchmark Their Performance: Compare their likely ad metrics (CPC, CVR, etc.) to the industry averages in this guide. Does it look like they’re operating profitably?
- Find Your Angle: Now, look for the gaps. Can you serve a smaller, overlooked sub-niche? Could you offer a simpler or more affordable solution that solves the same core problem?
Following this method gives you a clear, data-backed advantage right out of the gate, which dramatically boosts your chances of building something that actually succeeds.
A Few Common Questions About SaaS Ad Benchmarks
If you're diving into B2B SaaS ad benchmarks, you probably have a few questions. Let's tackle some of the most common ones to help you make better, more informed decisions for your campaigns.
How Often Do B2B SaaS Advertising Benchmarks Change?
The short answer? Constantly. B2B SaaS ad benchmarks aren't set in stone. They can shift every year, or even every quarter, thanks to economic swings, platform algorithm changes, and new competitors popping up.
Metrics like Cost Per Click (CPC) and Click-Through Rate (CTR) are especially volatile. A good rule of thumb is to check for updated benchmark reports at least once a year to make sure your targets are still realistic.
That said, don't get bogged down in short-term fluctuations. Focus on the bigger picture. For example, LinkedIn has always been a premium B2B channel—it costs more, but the lead quality is generally higher. That's a stable trend, even if the exact CPCs move around from month to month.
What Is a Good ROAS for B2B SaaS?
There’s no magic number here. A "good" Return on Ad Spend (ROAS) for a B2B SaaS company really depends on your profit margins and Customer Lifetime Value (LTV).
A solid target for many is a 3:1 or 4:1 ratio. This simply means you're bringing in $3 to $4 in revenue for every $1 you put into ads.
But context is everything. If you're an early-stage startup trying to grow fast, a lower ROAS (even 2:1) could be great, especially if your LTV is high and your main goal is grabbing market share. The most important thing is making sure your ROAS keeps your Customer Acquisition Cost (CAC) payback period at a healthy length—ideally, under 12 months.
Why Are My Campaign Metrics Different From These Benchmarks?
It's completely normal for your campaign numbers to look different from the industry averages. Think of these benchmarks as a compass, not a GPS. They give you a direction, but your actual path will vary.
If your metrics are way off, use it as a signal to dig deeper into your ad funnel. A few things could be at play:
- Your Niche: If you're in a crowded space like project management software, you're going to see much higher CPCs than someone in a brand-new SaaS category.
- Your Targeting: Running ads to a broad audience will almost always result in lower CTRs than when you're retargeting a small, highly-interested group.
- Your Creative and Landing Page: This is a big one. If your ad makes a promise that your landing page doesn't deliver on, your performance will suffer.
Simple Example: If your Click-Through Rate is low, your ad copy or creative probably isn't resonating. But if your CTR is great and your Conversion Rate is low, the problem is almost definitely on your landing page or with the offer itself.
Stop guessing which SaaS ideas are profitable. With Proven SaaS, you can instantly discover validated niches by seeing which competitors are already spending thousands on ads. Our platform analyzes real ad spend to uncover markets with proven demand.
Find your next profitable SaaS idea today on proven-saas.com
Build SaaS That's
Already Proven.
14,500+ SaaS with real revenue, ads & tech stacks.
Skip the guesswork. Build what works.
Trusted by 1,800+ founders